The day may come when a seasoned, key employee tells you about their plan to leave the company in a month. This situation isn’t extraordinary: HR specialists and managers in any organization have been there. What’s clear is that employees and managers will have work to do. Hiring managers will open a position, screen candidates in their database that fit the job description and try their best to fill a talent gap as soon as possible. A department leader would temporarily spread this person’s responsibilities around other team members. Well, knowing the probability of events like this one before they happen would bring extra time to retain a valuable employee or search for another one.
The problem can even be viewed on a grander scale. Amid an intense war for top talent, companies must differentiate themselves in the global marketplace to attract and retain people that deliver the most value: “As the market for high‐performing and high‐potential talent is becoming much more 'efficient' in many firms, top talent is becoming simultaneously more expensive and more easily lost to competitors,” stresses professor of workforce analytics Mark Huselid in The science and practice of workforce analytics: Introduction to the HRM special issue.
Moreover, retaining professionals will be more difficult in the future because millennials generally stick around with one employee for a shorter time than the older generations. In January 2018, the US Bureau of Labor Statistics conducted an employee tenure survey. One of the findings suggests that younger employees (aged 25-34) tend to stay with their current employer during 2.8 years, compared to professionals from 55 to 64 whose median tenure was 10.1 years.
Yuliia Melkova, the HR director at AltexSoft notes: “The main goal of working with people is creating an atmosphere in which employees feel that their daily work is meaningful for a company, in which they want to grow and develop, and have opportunities for this. And from a business perspective, all these factors influence the company's efficient growth."
Creating and maintaining a great environment comes with the understanding who the high performers are and how to keep them inspired, as well as who is lagging and why. Mark Huselid and Dana Minbaeva in Big Data and HRM call these measures the understanding of the workforce quality. And workforce analytics is one of the solutions that help companies keep up with the competition for human capital in the current economic situation.
In this article, we’ll discuss the purpose of people analytics, its common use cases, and provide a roadmap to implement HR analytics in an organization.
What is people and HR analytics?
People analytics is the analysis of employee-related data using tools and metrics. Mark Huselid highlights that the goal of HR analytics activities is to understand, quantify, manage, and improve the role of talent in the execution of strategy and value creation. It entails collecting data from internal and external sources, preprocessing, storing, and analyzing it to get insights about people on whose competence and commitment an organization's performance depends.
Analytics insights allow human resource managers to make informed decisions related to employee lifecycle, such as recruitment, training, performance evaluation, compensation, or education program planning.
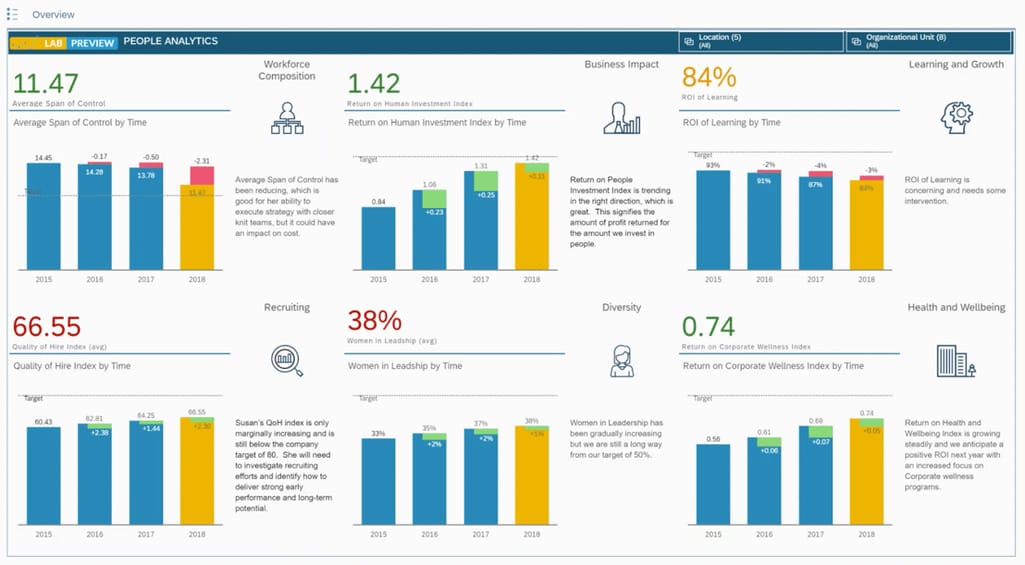
Dashboard with key metrics on recruiting, workforce composition, diversity, wellbeing, business impact, and learning. Source: SAP
For instance, Joan Manuel Perez Meiss, HR/Analytics of Belatrix Software, says they rely on data analysis results to tackle various issues: “Think of any unwanted and measurable behavior like high absenteeism or high turnover rates, the lack of talent available to cover the pipeline or the difficulty to recruit high performing teams, among others.”
Besides automating HR operations and providing wide analytical capabilities, HRM systems help in other areas of collaboration between employees and a company: “HRM systems help build a unique company culture, maintain its own communication style within the organization, and facilitate employee feedback. Every process that is automated increases the efficiency and transparency of business,” sums up Yuliia.
Descriptive and predictive analytics for solving employee-related questions
Generally, HR managers apply two types of analytics to get insights about a company’s workforce. Descriptive analytics is used to gather and analyze data that represents the current state of things or historical events. With descriptive analytics, one answers questions like “what happened?” or “what is happening?” For example, managers can define the average employee tenure across departments or in a company as a whole, discover five critical reasons for people leaving or compare budgets for personal education by years and units.
Forecasting future outcomes, events or values based on the analysis of current and historical data is done with predictive analytics. Predictive analytics helps to answer questions like what is likely to happen? Predictive analytics requires numerous statistical techniques, including data mining (detecting patterns in data) and machine learning.
Organizations already use predictive analytics to optimize operations and learn how to improve the employee experience. Let’s explore several popular areas of its application.
Smarter recruitment and people management
HR specialists can augment background checks with tools that explore and analyze an individual's activity on social media and other sites and forecast their tendency to express toxic behaviors like sexism, sexual harassment, intolerance, or bullying. One of these tools, Fama, uses machine learning and natural language processing to analyze public online content and internal HR data to spot such red flags.
Oracle Recruiting Cloud users can predict the likelihood of a candidate accepting a job offer. That way, an employer can edit the job offer (add or adjust bonuses, compensation, etc.) to increase the chances that a specialist agrees to its terms. The tool can update itself with employers’ data about the outcome of previous offers and acceptances over time.
Forecasting employee turnover
Predictive analytics with machine learning takes employee retention and engagement to another level. It allows for defining imperceptible risk factors that contribute to someone’s decision to quit. For instance, McKinsey used ML algorithms to determine the three variables driving 60 percent of the attrition among their managers. The findings showed that these variables weren’t connected to the number of working hours, travel, or compensation.
Experian, provider of a workforce analytics solution to retain talent among other services, used to struggle to keep its employees on board itself. In 2016, the company attrition rate was 4 percent higher than the industry benchmark. With every 1 percent turnover increase, the company was losing nearly $3 million. HR specialists couldn’t find out the reasons why people leave the organization because they didn’t have relevant data that would provide a multidimensional view of their workforce. To solve the problem comprehensively, specialists decided to enhance HR data management with an in-house analytics solution.
“The platform takes in data from up to 200 employee attributes including core HR people and talent data to give a comprehensive assessment of those at risk of leaving,” said Experian. It provides a risk score for each person that’s calculated by assigning 15-20 attributes that can trigger turnover risk.
Experian didn’t disclose why employees were leaving but noted that one of the success factors was rich data the company owns. The company used its Financial Strategy Segments credit data that describes individuals’ financial behavior and includes datasets on lifestyle, demographics, product consumption, and other aspects of life.
The initiative was successful: Thanks to predictive workforce analytics, global attrition had decreased by four percent, which saved the company $14 million over two years. Eventually, Experian started providing its solution to other businesses.
Predicting sick leaves or days off
One of the use cases for predictive analytics in HRM that Deloitte briefly described in the 2016 Global Human Capital Trends report was prediction of unscheduled absences. For instance, it reported that automobile companies were studying the patterns of unplanned absences to predict when employees are likely to take a day off. Using absence forecasts, managers would be able to reschedule shifts and/or assign extra staff.
In March 2019, provider of financial protection benefits Unum Group launched a closed pilot project with illness forecast application provider Sickweather.
The project identifies correlations between Sickweather’s data from its real-time human health map and Unum’s Family and Medical Leave Act (FMLA) and coded sick leave paid time off (PTO) data to forecast employee illness-related absence.
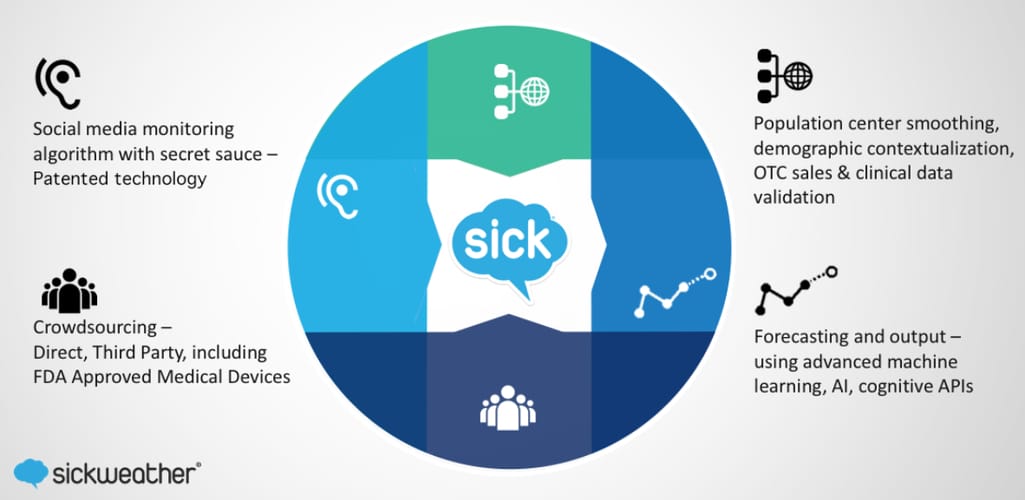
Data sources Sickweather uses to predict employee illnesses. Source: Sickweather
Sickweather aggregates and analyzes real-time social media, crowdsourced data on illnesses across locations, point-of-sale data on medications, population, and clinical data, along with historical data curated since 2011. The provider claims that its machine learning models predict the rate of illnesses up to 15 weeks in advance with 91 percent accuracy.
Workforce planning
Identifying current and future skill gaps is another application for predictive analytics. Deloitte reports that Mexico's Ministry of Energy uses a predictive workforce planning and analytics model to learn about the current shortage of skilled workers in the oil and gas industry and predict one over a 10-year horizon. “The model leverages a number of adjustable macroeconomic variables such as oil prices and exchange rates that correlate strongly to the demand and supply of skilled labor,” notes Deloitte. The ministry also started using workforce planning and analytics in such sectors as renewable energy and sustainability.
A guide to implementing HR analytics
Do you want to implement people analytics in your organization? We’ll tell you how to establish and implement HR data collection and analysis with a step-by-step plan.
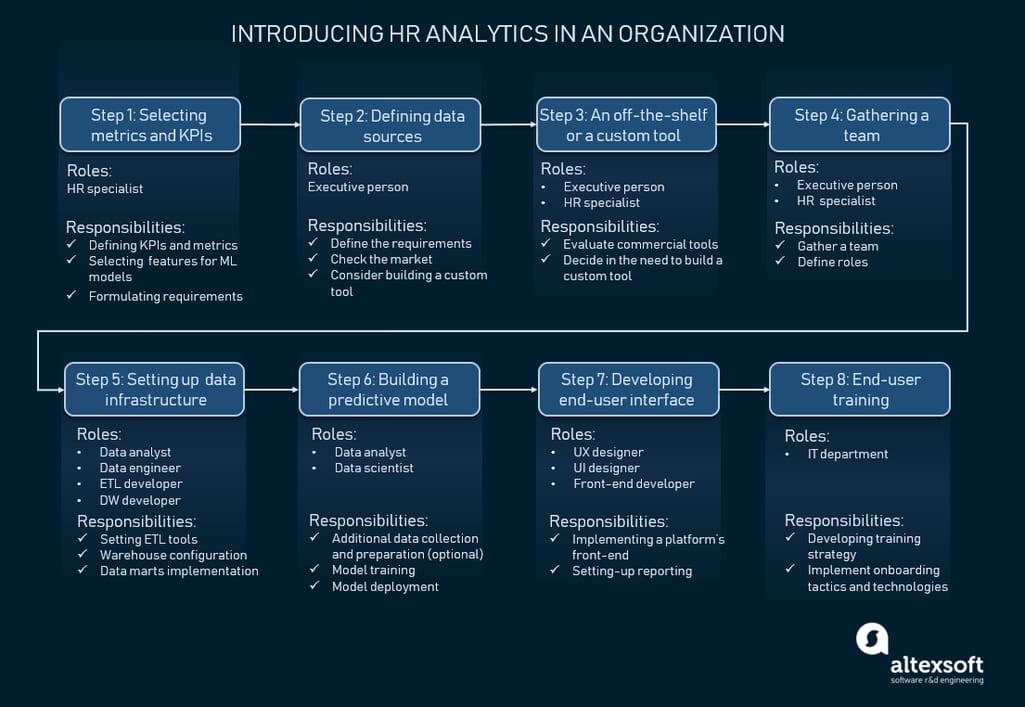
A roadmap of HR analytics strategy implementation
Step 1. Choose metrics and KPIs to monitor and predict
To kick-start the HR analytics in a company, formulate the questions about the workforce that correlate to business outcomes a company must achieve: What do we need to measure? How are given metrics interconnected with each other? What events or values are necessary to forecast? If you already use custom KPIs or you want to introduce some, document them in addition to standard HR metrics. When documenting a custom KPI or metric, describe in detail:
What measure it expresses
How it’s calculated/generated
In what form it’s represented (text, numeric)
With what frequency the measure must be taken.
From what data source an indicator will be retrieved for the processing and analysis.
Selecting indicators and metrics for HR systems with predictive capabilities is a task in itself. Machine learning models take into account problem properties called features to forecast outputs (future events or values). To develop a model able to predict outcomes with needed accuracy, specialists must select relevant features for its training. So, you need to evaluate the set of factors that may lead to a given (positive or negative) future event you intend to predict.
For instance, indicators to consider and use as features to measure or predict employee engagement may include:
Social media posts
Messages and comments in work chats
Tenure
Number of days/weeks/months since the last promotion
Number of days/weeks since a meeting with an HR manager and a department manager
Compensation
Team size
Number of people in a work room
Overtime hours
Vacation days used
Commute time
Net promoter score.
By the end of this step, you will define the metrics and KPIs to track and predict, and factors to consider within every metric. In other words, you'll have a view of a future platform's capabilities.
Step 2. Define data sources
Once you defined indicators to track or forecast, documenting sources from which to pull this data won’t be difficult. While the number of data sources is company-dependent, they may include:
ERP HR module (generally has several features and thus data related to time tracking, employee scheduling, payroll management, or absence management.)
Recruiting tools/applicant tracking systems
Employee scheduling software
Talent management software
Training systems.
Google Sheets or Excel files, if you use those
Skill testing solutions.
If you plan to consider data that candidates or current employees share on social media sites, add these portals to your list. Also, make sure you have the right to access and use individual-level data collected by external survey companies.
Step 3. Decide on a tool: off-the-shelf or custom
So, you defined from which systems to source information, handled data ownership issues with partners, outlined the scope of tasks your HR system must perform, as well as metrics and KPIs to measure, and events/or forecast. The next consideration is whether to get an off-the-shelf tool or build your own system.
Off-the-shelf solutions. There are many HR platforms available on the market, such as Gust, Cezanne HR, Zoho People Plus, or Namely. These products have features for recruitment, onboarding, performance management, payroll and benefits management, employee engagement, etc. End-to-end BI solutions also include HR use cases, for example, Microsoft Power BI.
When it comes to AI-based solutions, the market has a lot to offer as well. For instance, IBM provides AI-powered talent management solutions for talent acquisition, development, and assessment. SAP will make its SuccessFactors People Analytics generally available at the end of 2019 or the beginning of 2020. The platform provides “business intelligence, planning, and predictive capabilities within one product” and uses AI and ML. Zoho People Plus includes the Zia assistant to help HR managers in scheduling interviews, client meetings, or employee orientation events. The provider claims it’s an AI assistant. Ideal, Teamable, Sniper AI, or RolePoint are some of the AI-based tools for candidate search, pre-screening, and recruiting.
The obvious benefit of an off-the-shelf HR tool is simplicity. You choose a tool, register yourself and/or other users, and start doing your job. Generally, no development is required. A provider maintains the platform and handles the storage of your data.
Software development companies may follow a mixed approach: “Since we are a software company, we tend to have our own developments along with off-the-shelf solutions, which we feed and reinforce with a little code here and there, in order to get the best of them,” notes Joan Manuel Perez Meiss of Belatrix Software.
Opting for custom analytics solutions. However, out-of-the-box software may require complex customization to enable you to change the game for your operations. If that’s the case, you would either need to assign your developers or hire a consultant or a vendor to tailor the product to your requirements. And, that takes time and more money. If you can’t match the functionality you need with any commercial tools, consider designing and developing a custom solution.
Talking about data…"One of the main and most important aspects of using in-house tools is security. It's more difficult to control data confidentiality if you work with a commercial system that's being supported externally,” says AltexSoft HR director Yuliia Melkova.
Other aspects of using an in-house HR system are the ability to develop the one that fully meets a company's unique needs and fix the system once these needs change. “Modifying and improving the in-house system would take less time if the company worked with an external developer,” adds Yuliia.
In addition, custom, ML-based solutions are powered by custom predictive models that are trained on company data, which ensures accurate predictions.
Step 4. Gather a team
If building a custom HR analytics solution is a better option for your company, you’ll need to gather a team or hire one. The team must include both human resource and tech specialists that will transform business requirements into features and implement the solution’s back and front end. The project team might include these roles:
HR manager – responsible for developing and maintaining HR plans and operations, defines a set of modules and features in a system and suggests what KPIs and metrics it must track and predict.
Data engineer – builds interfaces and infrastructure to enable access to data. They make data pipelines work. We wrote an article on data engineering and discussed the data engineer role with peers, so check it out if you’re curious.
Data warehouse developer – models, develops, and maintains data storages.
Data analyst – defines ways of retrieving data from sources, chooses a subgroup of data that works best for solving a specific problem, processes it, and analyzes results with the help of statistical techniques.
ETL developer – a software engineer that manages data extraction, its transformation, and loading into a final storage system.
Data scientist – handles data analysis to uncover insights about the organization's operations and supports decision-making. The specialist applies such techniques as data mining, machine learning, deep learning (the subset of ML), as well as preprocesses and transforms datasets to prepare them for model training.
Front-end developer – codes the side of application with which a user interacts – a client-side AKA front-end.
UX designer – defines optimal and efficient scenarios of interaction with a product.
UI designer – creates the visual style and look of a user interface.
Team structure depends on solution complexity, budget, and timeline. One specialist may have more responsibilities than we described. For instance, a data engineer can manage the ETL process (that’s a part of their knowledge and expertise), or a data scientist can be in charge of data collection approaches, data selection, and visualization.
Step 5. Set up data infrastructure: ETL and a data warehouse
Imagine you drive to numerous stores around the city to get all the items on a shopping list. You enter the first store, find the right product, purchase it, put it in the trunk, and drive to another location. Finally, you drop all those different goods at home. Without a car with a tank of gas, money, a place to store items, and knowing where to buy them, you couldn’t complete this task. So, step four is about getting the infrastructure to extract data from different systems and transmit it to a single storage system for analysis and reporting.
The infrastructure for this task (particularly the HR analytics system architecture) includes a data integration tool and a data warehouse.
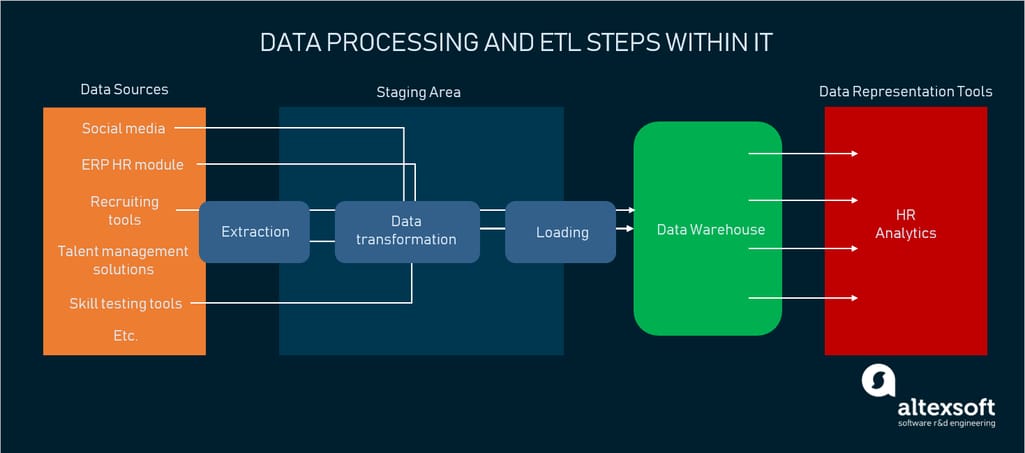
Tools for data integration. Data integration tools move data from initial systems into a warehouse. ETL (extract, transform, load) is of the ways to carry out this process. And, that's why data integration tools are also called ETL tools. The ETL process includes three phases:
Extract – connecting to sources of information and retrieving it.
Transform – processing raw data and formatting it according to predefined standards. Data is transformed while being placed in a temporary storage – staging area.
Load – uploading transformed data into the warehouse, where it can be queried and used both for visualization (descriptive analytics level) and for drawing predictions (predictive level).
ETL as one of the data processing phases
Data warehouse. The data warehouse is designed for consolidating, storing, and analyzing large amounts of structured data. It happens that an organization has many departments, each of which is dealing with data of specific characteristics. In this case, the data warehouse can be split into smaller components – data marts – to simplify and speed up data requests. The focus on aggregating data from multiple periods differentiates data warehouses from operational databases, whose purpose is to update huge volumes of data in real-time.
You can build ETL tools and a data warehouse or use components from vendors. We already surveyed BI tools from providers and developers in a separate article, so check it out if you’re interested.
So, your team has set up the flow of data and configured the data warehouse. If you’re building an HR system with predictive capabilities, the next task is to produce a machine-learning-based predictive model. And that’s the data scientist’s job. If you don’t need an ML-based solution, skip the following section and proceed with the next phase – user interface development.
Step 6. Build a predictive model
The central goal of this phase is to develop a model that provides the most accurate predictions for a given question.
Data scientists check whether a data warehouse contains data required for solving a specific problem. If there is not enough data, they initiate additional data collection. After having prepared data for machine learning, the specialists start model training.
Model training is about providing an ML algorithm with historical training data with target attributes (correct answers to predict) or without them. Data with mapped attributes (AKA labels) are used if you want to predict known attributes in new data, and this model training style is called supervised learning. The learning algorithm will eventually learn how to find patterns in the training data that map the input data attributes to the correct answer and outputs an ML model that can spot these patterns in new data. With supervised learning, you can answer questions like “Will this employee quit in a given period or not?” or “What is the likelihood that the individual will quit?" The answer to the second question will be numeric, an attrition score.
Training data without mapped answers is done during unsupervised learning. When applied to HR use cases, you can cluster the workforce by similarities or differences via finding unobvious patterns in their data, for instance, defining the criteria that reveals who becomes a high performer or a low one.
Then models are tested and evaluated on their accuracy, and the best model is deployed into a software.
That’s a short way of describing this complex and time-consuming process. Our article about machine learning project structure provides a more detailed view of data preparation, model training, and deployment.
Step 7. Develop UI of a solution
The main purpose of this step is to develop a solution front-end that lets business users without a data engineering or data science background manipulate data and generate custom reports: choose sources and combine datasets for analysis via a drag-and-drop interface. A checklist of nice-to-have features might include:
Choosing between static and dynamic (interactive) dashboards. The latter updates with data and allows users to drill down into data representation.
A wide selection of charts
The ability to create ad hoc reports
Sharable dashboards
The option to upload custom visuals
There is always the option to use libraries for data visualization to speed up development.
Step 8. Train employees on how to use the system
The end-user training is a must since it's aimed at showing new system functionality. A piece of advice is to take into account user technical skill level before developing training approaches. For instance, documentation written in plain language with explanations of the main concepts and terms and screenshots would be helpful for non-tech users. Video tutorials and interactive onboarding tools that instruct users along the way are also good supplements to the text sources. It's not only about self-service training tools and materials – a seminar-style group demonstration can work as well.
Choose your approach
Great employee experience leads to better business outcomes. Consequently, executive and line managers are looking for solutions that can provide a deep and complete view of what’s going on in the company and what causes what. Deloitte notes that the purpose of people analytics is expanding from specifying human resources management to shedding the light on all operations, focusing on the business itself.
Vendors respond to this tendency and demand. They develop platforms that tackle all aspects of the employee lifecycle, make people analytics dashboards on ERP available solutions accessible to senior leaders. The market has plenty of tools for solving a specific problem, such as talent acquisition or monitoring employee engagement as well. Predictive analytics with machine learning is also gaining popularity. According to the 2018 Gartner AI Enterprise Perceptions, Plans and Implementation Survey, 23 percent of organizations who were already piloting or using AI, were doing so in the HR and recruiting domain.
On the other hand, developing custom HRM platforms in-house is also a common practice among businesses. The benefits of this approach are higher levels of corporate data security, the ability to build a tool that perfectly matches requirements, including ML-based solutions with proprietary models.