Airlines were one of the first businesses to introduce cutting-edge revenue management techniques. They pioneered the idea of changing prices on the same products —in their case, seats — dynamically, depending on the expected market conditions and willingness of passengers to pay for a particular flight.
The first attempts to forecast demand and adjust fares accordingly were based mainly on the gut feeling of industry experts. However, big carriers quickly found the manual approach unreliable and invested in analytical software. Say, Delta Airlines built its first computerized dynamic pricing model in the early 1980s.
Since then, technologies have become more powerful and, at the same time, more accessible to players of all sizes. This article shares our experience developing a dynamic pricing system for UPfamily brands, including an international tour operator, Join UP!, and a private low-cost and charter carrier, SkyUp.
Air prices: Why they change all the time
No business prices its products randomly. The process always takes planning and thorough calculations to maintain a shaky balance between making a profit and staying competitive. However, airlines stand out from the rest in terms of the complexity of their pricing strategies. Why? The answer lies in the nature of flight products.
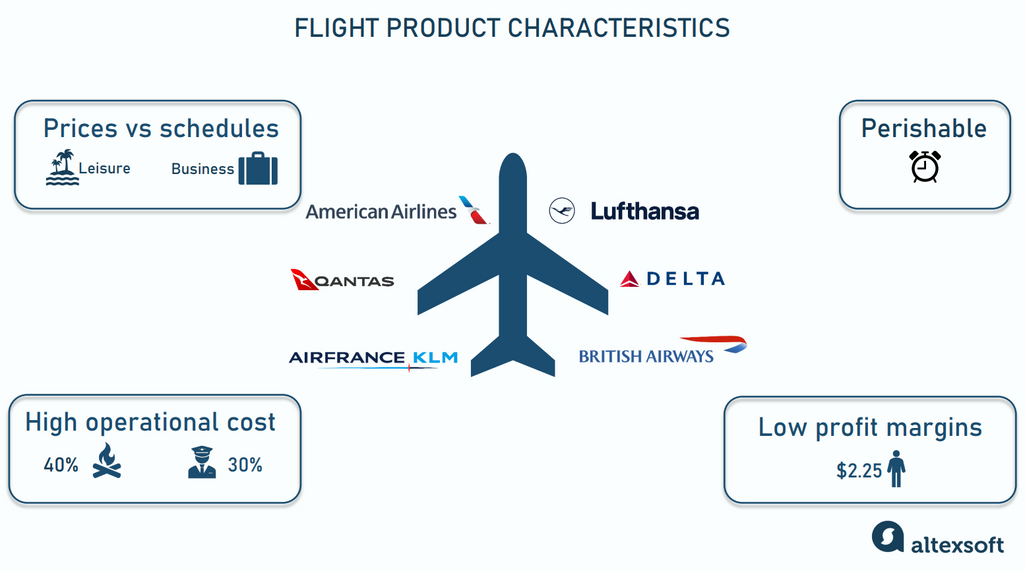
Key features of a flight as a product
Prices and schedules are the main drivers of passenger decisions. No offense, but most people — except for loyalty program members — don’t care which brand they fly with. The two main factors impacting buyer decisions in the air industry are
- prices for leisure travelers and
- schedules for corporate travelers.
Corporate travelers represent only 12 percent of all passengers, with 75 percent of the profit on specific routes. To meet the needs of this high value audience, airlines should fly frequently to multiple business destinations. However, the flight cost structure dictates the opposite scenario.
The cost of a single flight itself makes up the biggest part of flight fares. This includes fuel (up to 40 percent of an air ticket price), crew salaries (up to 30 percent), maintenance, airport charges, and other fees. At the same time, the cost of each additional passenger is relatively low. From this perspective, airlines should fly less frequently but at full load.
Flights are perishable products. Nobody will purchase them after a plane leaves the ground. As a result, airlines will lose revenue while still bearing almost the same flight cost. So it’s critical to sell out as many seats as possible before takeoff.
Flights are products with thin profit margins. In 2023, IATA announced that airlines make, on average, $2.25 per passenger, with a net profit margin of 1.2 percent, considered something to celebrate. Of course, besides selling bare seats, carriers have other sources of revenue — like ancillaries or frequent flyer programs. Still, their core products are flights, which, as we said above, are extremely expensive to operate. At the same time, the air travel industry is highly competitive, and the slightest rise in price may result in empty seats.
All those aspects make revenue management extremely challenging. If your tickets are too expensive and business-oriented, you’re at risk of flying almost empty. Low prices, on the other hand, will ensure full occupancy and passengers’ love. Yet, extreme generosity may bankrupt you since you won’t earn enough to cover huge expenses.
Under such pressure, airlines can’t afford to set a permanent rate. They must monitor various parameters to adjust prices to the current market situation. Among key factors impacting a traveler’s willingness to buy a ticket are
- seasonality,
- route popularity,
- competitors’ deals,
- time of booking,
- booking channel,
- and more.
Since these factors constantly change, so do airfares — prices on the same seat on the same flight can jump up and down throughout a year, a month, a week, and even a day.
For example, when selling a flight to the Bahamas on peak season dates, an airline may assume that passengers will tend to book tickets early, probably several months before their vacations. So, revenue managers set starting fares high and then lower them at some point to fill seats.
Business travel is a different story. Carriers often price seats on such routes relatively low initially and increase them sharply for corporate travelers booking last minute.
Watch our video to learn more about how ticket pricing works.


Dynamic pricing in airline industry: why flight fares constantly change
Despite the obvious complexity of airline pricing, many smaller airlines still rely exclusively on live specialists to tweak rates with an eye to shifts in demand. It takes a lot of time and involves human factors leading to errors. AI promises to improve the efficiency of revenue managers. But to what degree? And how do you start implementing it at the lowest cost so that you can validate the idea before heavily investing in it?
With UPfamily, we built a machine learning proof of concept — the simplest version of the potential product to check its feasibility. The work on the project lasted three months. Below, we’ll highlight the theoretical background and practical steps our collaboration involves.
Step 1: Prepare data
The accuracy of price recommendations directly depends on the amount and quality of data you use to train a predictive model.
Quantity and quality for reliable results
Let’s start with the amount: How much information is enough? One year’s worth of historical data lets you analyze patterns and trends in a 12-month cycle. But what if that particular year was atypical? To avoid bias, data scientists prefer to work with observations collected from at least two cycles. In our case, the client provided us with data on bookings for three years to achieve even more credible results.
Even if you take data from a single source, you still must ensure its quality. This process includes bringing variables into the same format, substituting missing values, correcting errors and inconsistencies, and other standard operations.
To dive deeper into the process, read our article on how to prepare your dataset for machine learning or watch our 14-minute video.


How is data prepared for machine learning?
It’s also essential to reduce the number of parameters (table columns) in the dataset to only those required by your goal. Excessive information that is useless for prediction may result in overly complex models capturing irrelevant details. We concentrated on several major attributes — such as route, date of booking, flight date, price, and occupancy rate on a particular flight.
Where to source data on competitors
Note that our model wasn’t supposed to consider competitors’ rates — which can be essential in other cases. Below, we list several popular flight pricing data vendors you can reach out to.
ATPCO (Airline Tariff Publishing Company), one of the staples of the traditional flight booking process, has around 318 million fares in its database. You can tap into pricing information in the following ways.
- Subscriptions. In this case, ATPCO will send you raw data using FTP once an hour.
- Assembled Data. ATPCO will clean and prepare data fitting your current goals in a format of your choice. You can create a request based on origins, destinations, and carriers you’re interested in and get a comprehensive dataset whenever your ML system needs it.
- API Integration. Routehappy APIs by ATPCO give you direct access to raw and assembled data.
Besides prices, ATPCO provides fare-related data, which includes amenities as well as fare benefits and restrictions.
FareTrack aggregates content from over 700 airlines — directly or via middlemen. It offers direct data feeds in your preferred format (Excel, CSV, FTP, and others) delivered at any frequency. You can also integrate your business intelligence system with FareTrackAPI.
Infare handles over ten years of historical data sourced from GDSs, OTAs, and airline websites. It covers about 200 parameters, including booking site name, carrier code, origin and destination airports, cabin class, departure days, and more. The company shares prepared datasets through the Snowflake data warehouse. It also sends data via FTP or cloud storage such as AWS, Google, or Azure. In this case, you can build datasets that fit your project needs from aggregated and enriched data. If you choose an FTP option, the format of data feeds will be adapted to your revenue management or pricing system.
Once all your data is ready, it’s time to start experimenting with different ML models to identify which one will produce the best results.
Step 2: Train models and choose the best one
With the same data, the accuracy of predictions can vary greatly from model to model. For example, deep learning networks require a lot of information to work properly. So, it makes no practical sense to use them if your dataset is small. In less obvious situations, it’s crucial to train and test several algorithms and select the most efficient for your particular case.
Our goal was to forecast the change in occupancy with each $10 price increase. Speaking the language of data science, we were solving a regression task. It’s an area of supervised machine learning aiming to predict numerical values (age, salary, error rate). The second broad category covered by supervised ML is classification when we forecast a class of the input data (young or old, poor or rich, true or false). Many machine learning algorithms handle both regression and classification tasks.
Below, we’ll look at models we trained and evaluated during the collaboration with UPfamily.
Multiple linear regression: ensuring transparency and computational efficiency
Linear regression (LR) is a basic algorithm to estimate correlations between a dependent variable (output) and an independent one (input). The theoretical guessing behind LR is that every alteration of an input will lead to a uniform and consistent change in the output. When visualized, LR predictions take the form of a straight line that minimizes the average difference between forecasts and historical values.
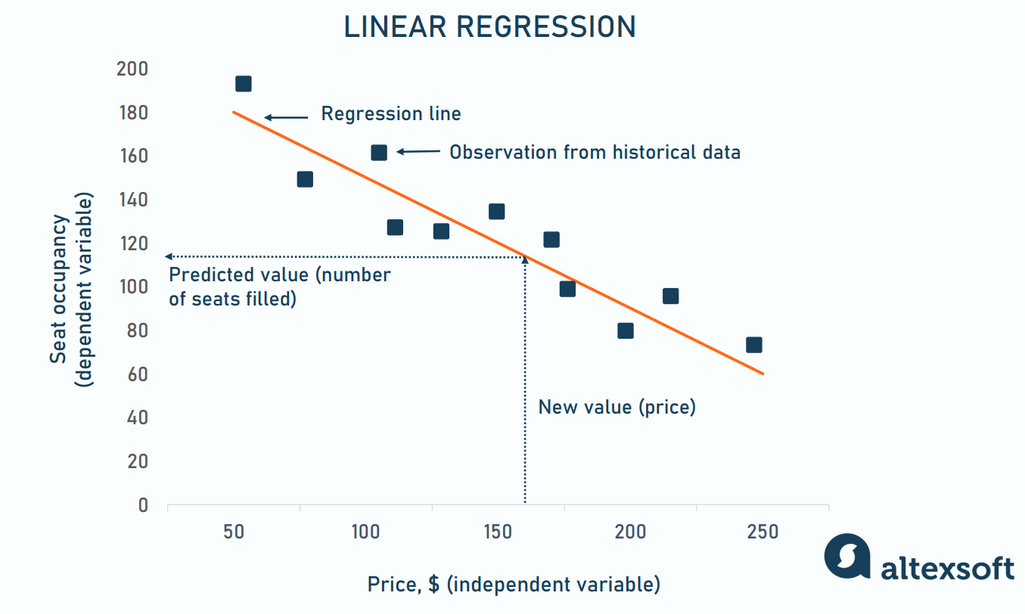
Simple linear regression example
At first sight, many relationships work this way. The more food you eat, the more weight you gain. The more you study, the more you earn. The lower price you set, the more seats you fill. LR helps you understand how strong the effect is and predict the value of the dependent variable (weight, monthly salary, seat occupancy) for any value of the independent one (calories, years of education, price.)
However, factors other than price influence occupancy as well. So, to build our model, we used a more advanced version of LR — multiple linear regression (MLR), that explores a cumulative linear impact of several independent variables on the output. While it can miss intricate (non-linear) relationships in data, MLR still has significant benefits.
- Transparency. MLR predictions are easy to interpret; you can see how each element modifies results.
- Computational efficiency. It requires less computing resources than more complex models but still can handle large datasets at a decent speed.
Jumping ahead a bit, MLR demonstrated the best results in solving our particular problem. So, at the end of the day, we chose it for our recommending system. Yet, we also tested two other algorithms that would potentially capture complex correlations and improve the output accuracy.
Support Vector Machine (SVM): handling complex relationships and outlines
A Support Vector Machine or SVM commonly applies to binary classification tasks when you categorize data in one of two groups — sentiment analysis (positive or negative), spam detection (spam or not spam), or image recognition (cat or dog).
The algorithm maps data points in multidimensional space and finds a hyperplane — a decision boundary that best divides them into classes. The hyperplane is located at a maximum distance (margin) from the closest data points belonging to different classes. These nearest data points, known as Support Vectors, impact the position of the hyperplane and make a model more resilient to outliers — values that significantly differ from the rest of the data.
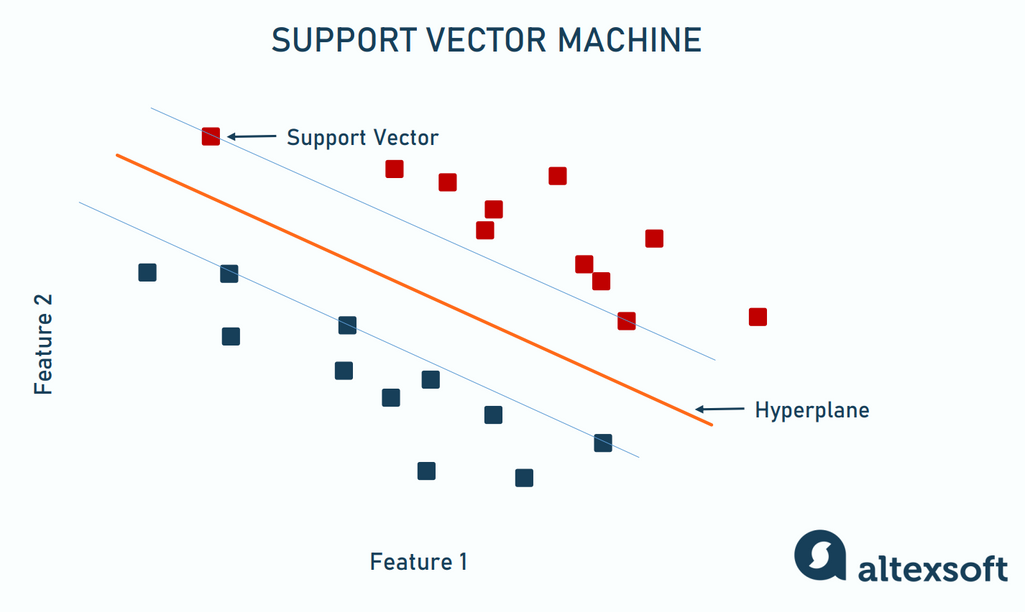
SVM was initially used for binary classification
The number of dimensions equals the number of features you consider. Two parameters require a 2-dimensional space, and the classes will be separated with a line. For three parameters, the boundary takes the form of a plane. If there are more, the algorithm creates a multidimensional hyperplane.
The concept of SVM turned out to be useful for regression tasks as well. It developed into the support vector regression (SVR) method that predicts the continuous values rather than acting as a divider between groups. The regression aims to find the decision boundary that crosses the maximum data points — overall, they must be as close to the hyperplane as possible.
Compared to multiple linear regression, SVR is more resilient to noises and, as we said above, can capture more complex relationships. At the same time, the approach has issues handling large datasets. Also, its results are hard to interpret (black box problem).
Unfortunately, the SVR model didn’t meet our expectations since it was not sensitive enough to 10-dollar price changes. We decided to try another algorithm designed to deal with large amounts of data.
LightGBM: speeding up the training process
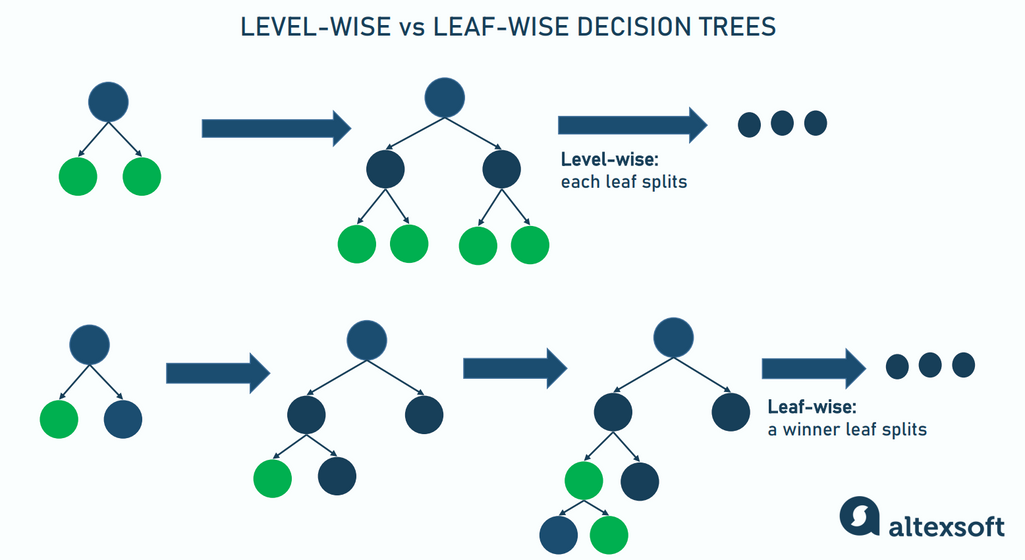
LightGBM, short for light gradient-boosting machine, is an ensemble learning framework introduced by Microsoft in 2016. It trains a sequence of decision trees, each fixing the mistakes of the previous iteration and boosting — improving — the accuracy. Eventually, it summarizes the results from all trees to generate a final prediction.
Unlike its predecessor, LightGBM takes the leaf-wise approach to growing trees. Traditionally, each decision node or leaf splits into possible outcomes, no matter its validity. This level-wise growth leads to redundancy and wasting computing resources on processing non-informative branches.
At the same time, LightGBM selects the single node with maximum information gain and develops it while discarding "losers." As a result, you can train a model faster, consuming less memory and achieving better performance.
It’s worth noting that LightGBM needs a lot of information to work properly so it’s not the best option for small datasets. Another issue is its inability to identify and prioritize features with the most predictive power. In our experiment, the LightGBM model failed to see the difference between a $50 and a $150 price increase and correlate occupancy predictions accordingly. That’s why we went further with a multiple linear regression.
Still, we used LightGBM to answer another question. Our team trained an additional model for flights with the following parameters:
- fewer than seven days remain before departure, and
- more than 50 seats are still unsold.
The model predicted how many seats would likely be filled during the time left.
Step 3: Build a price recommending system for informed revenue management decisions
So we had two models: MLR predicting a change in occupancy with each $10 price increase and LightGBM making short-time forecasts about the number of last-minute bookings. Our next step was to turn predictions into practical recommendations revenue managers can use in their daily work.
We created a separate algorithm to detect the optimal price, iterating through MLR predictions. Its output was the rate that would bring the highest revenue for a given flight. As for the second model, we recommended increasing prices if the number of bookings predicted was higher than the number of available seats — and vice versa.
We set the ML system to make predictions three times a day and automatically e-mail recommendations to UPfamily’s revenue managers in a convenient format. The estimations made at the proof-of-concept stage showed that AI price advice could boost revenue by 3 to 5 percent. That’s good enough, considering the overall low marginality of air travel. Further work on the project and experimenting with more advanced models could potentially enhance the results.
