All business operates with data – information generated from your company’s many internal and external sources. And these data channels serve as a pair of eyes for executives, supplying them with analytical information about what is going on with the business and the market. Accordingly, any misconception, inaccuracy, or lack of information may lead to a distorted view of the market situation as well as internal operations – followed by bad decisions.
Making data-driven decisions requires a 360° view of all the aspects of your business, even those you didn’t think of. But how do you turn unstructured data chunks into something useful? The answer is business intelligence.
In this article, we’ll discuss the actual steps in bringing business intelligence into your existing corporate infrastructure. You will learn how to set up a business intelligence strategy and integrate tools into your company workflow.
Learn about master data management, its examples, and how it improves data quality and business intelligence processes.
What is business intelligence?
Business intelligence or BI is a set of practices of collecting, structuring, and analyzing raw data to turn it into actionable business insights. BI considers methods and tools that transform unstructured data sets, compiling them into easy-to-grasp reports or information dashboards. The main purpose of BI is to support data-driven decision-making.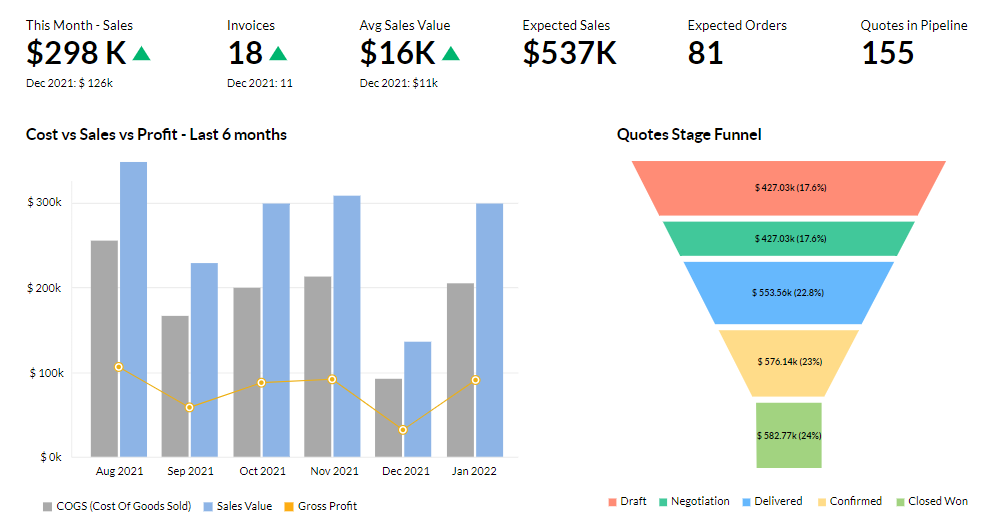
An example of an interactive dashboard for a sales department. Source: Zoho CRM
Business intelligence process: How does BI work?
The whole process of business intelligence can be divided into five main stages.
- Data gathering involves collecting information from a variety of sources, either external (e.g., market data providers, industry analytics, etc.) or internal (Google Analytics, CRM, ERP, etc.).
- Data cleaning/standardization means preparing collected data for analysis by validating data quality, ensuring its consistency, and so on (please check the linked articles for more details.)
- Data storage refers to loading data in the data warehouse and storing it for further usage.
- Data analysis is actually the automated process of turning raw data into valuable, actionable information by applying various quantitative and qualitative analytical techniques.
- Reporting involves generating dashboards, graphical imagery, or other forms of readable visual representation of analytics results that users can interact with or extract actionable insights from.
Business intelligence is a technology driven-process that relies heavily on input. Technologies used in BI to transform unstructured or semi-structured data can also be used for data mining, as well as being front-end tools to work with big data.
Business intelligence vs predictive analytics
The definition of business intelligence is often confusing as it intersects with other spheres of knowledge, especially predictive analytics. However, it’s not correct to use these two terms interchangeably, so let’s clear it up.
There are four main stages of analytics maturity of any organization:
- Descriptive analytics
- Diagnostic analytics
- Predictive analytics
- Prescriptive analytics
Business intelligence refers to the first two stages as it helps answer the questions of what is/was happening and why. With the help of descriptive and diagnostic analytics – or BI -- businesses can study the market conditions of their industry, as well as their internal processes. A historical data overview helps find pain points and development opportunities.
Predictive analytics, on the contrary, is concerned with forecasting based on data processing of past and current events. Instead of producing overviews of historical events, predictive analysis makes predictions about future business trends. It also enables scenario simulation and comparison. To make it possible, complex data architecture involving advanced ML techniques has to be created by a professional data science team.
So we can say that predictive analytics can be considered the next stage of business intelligence. Meanwhile, prescriptive analytics is the fourth, most advanced type that aims at finding solutions to business problems and suggests actions to solve them.
Business intelligence architecture: ETL, data warehouses, OLAP, and data marts
Architecture is a broad concept that can include the organizational aspect (data governance, policies, standards, etc.), but in this article, we’ll mainly focus on the technological infrastructure. Most often, it includes
- data sources
- ETL (Extract, Transform, Load) or data integration tools
- data warehouse
- online analytical processing (OLAP) cubes
- data marts
- reporting (BI) tools
We'll now examine all the infrastructure elements individually, but if you want to expand your knowledge about data engineering, check out our article or watch the video below.


Data engineering explained
To begin with, the core element of any BI architecture is a data warehouse. The warehouse is a database that keeps your information in a predefined format, usually structured, classified, and purged of errors.
However, if your data isn’t preprocessed, your BI tool or your IT department won’t be able to query it. For this reason, you can’t directly connect your data warehouse with your sources of information. Instead, you must use ETL tools.
ETL
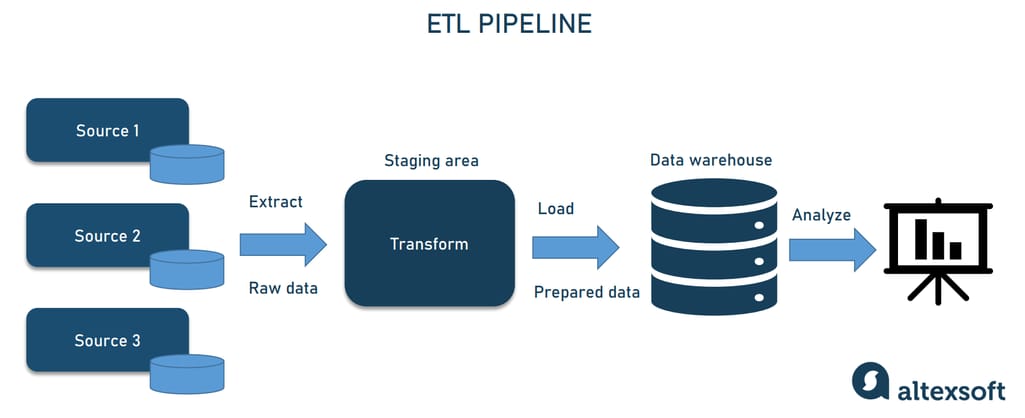
The ETL (Extract, Transform, Load) or data integration tools will preprocess raw data from the initial sources and send it to a warehouse in three consecutive steps.
- Data extraction. The ETL tool retrieves data from the data sources including ERP, CRM, spreadsheets, etc.
- Data transformation. After extraction, the ETL tool starts data processing. All extracted data is analyzed and duplicates are removed. The remaining data is standardized, sorted, filtered, and verified.
- Data loading. At this phase, transformed data is uploaded into the warehouse.
The ETL pipeline
Usually, ETL tools are provided out of the box with BI tools from vendors (we’ll cover the most popular ones further on).
Data warehouse
Once you’ve configured data transmission from the chosen sources, you have to set up a warehouse. In business intelligence, data warehouses are specific types of databases that usually store historical information in tabular formats. Warehouses are connected with data sources and ETL systems on one end and reporting tools or dashboard interfaces on the other. This allows for presenting data from various systems via a single interface.
But a warehouse usually contains extensive amounts of information (100GB+), which makes it understandably slow to respond to queries. In some cases, data can be stored unstructured or semi-structured, which leads to a high error rate when parsing data to generate a report. Analytics might require a certain type of data grouped in one storage space for ease of use. That is why businesses use additional technologies to provide faster access to smaller, more thematic chunks of information.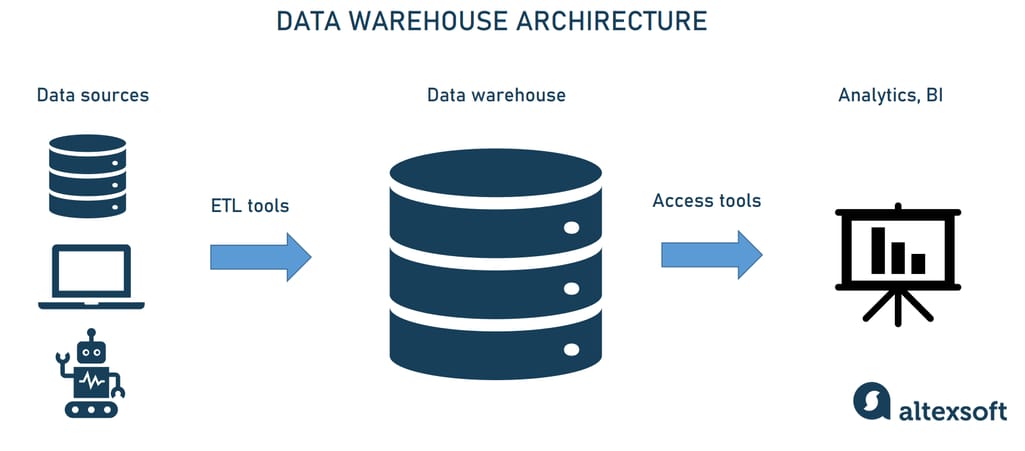
Data warehouse architecture
Recommendation: If you don’t have large volumes of data, the utilization of a simple SQL warehouse is sufficient. Additional structural elements like data marts will cost you a lot without providing any value.
Data warehouse + OLAP cubes
Data stored in a warehouse has two dimensions, as it’s usually depicted in a spreadsheet format (tables and rows). The way a warehouse stores data is also called a relational database. It may include thousands of data types in one database, so querying a data warehouse takes a significant amount of time. To satisfy analysts' needs to access data quickly, analyze it from different dimensions, and group whenever they need it, OLAP cubes are used.
OLAP or online analytical processing is a technology that analyzes and represents data from multiple dimensions simultaneously. Structuring your data in OLAP cubes helps to overcome the limitations of a data warehouse.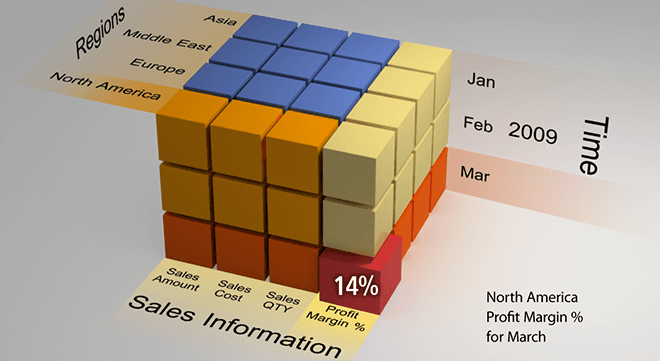
OLAP cube model. Source: Busitelce.com
OLAP cube is a data structure optimized for quick analysis of data from SQL databases (warehouse). Cubes source data from a data warehouse being a smaller representation of it. However, the structure of data assumes that there are more than 2 dimensions (row and column format of spreadsheets). Dimensions are the crucial elements that form the report, e.g., for the sales department it might be
- Salesperson
- Sales amount
- Product
- Region
- Time period
Cubes form a multidimensional database of information that can be adapted to group it in different ways and create reports more quickly. A warehouse and OLAP are used in conjunction, as cubes store a relatively small amount of data and serve for processing convenience.
Recommendation: The data warehouse + OLAP cubes architecture can be used by companies of all sizes that require complex multidimensional analysis of the information. If you don’t want to bombard your warehouse with queries, consider an OLAP architectural approach.
Data warehouse + data mart technologies
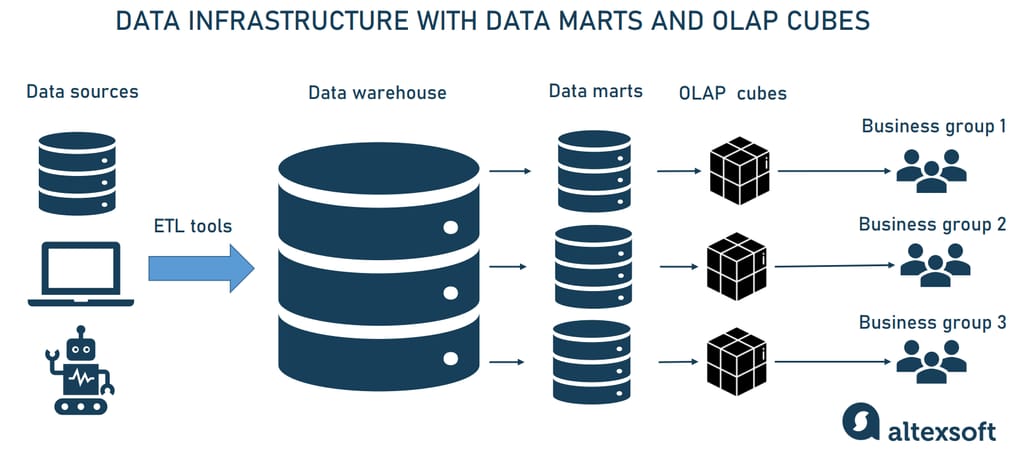
A warehouse is the first and biggest element of business intelligence architecture. A smaller representation of warehouse datasets is a data mart that gathers information dedicated to a particular subject area. With the help of data marts, separate departments can access required data.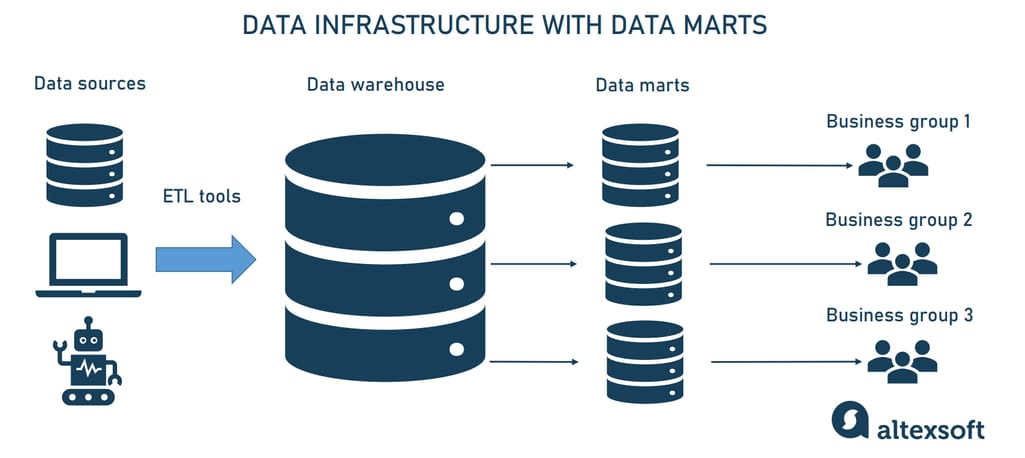
Data marts are smaller representations of the warehouse dedicated to specific data domains
Recommendation: Data warehouse + data marts is the second most popular architectural style. It allows establishment of constant reporting or easy access to information, without providing permissions to end users.
Hybrid architecture
Enterprise businesses may require multiple options for data management. Data marts and cubes are different technologies, but they are both used to represent smaller chunks of information from the warehouse. Data marts represent a problem-specific subset of a data warehouse, but they can be implemented differently. The implementation option includes relational databases (warehouse or any other SQL database), and multidimensional, which are basically OLAP cubes. So you can use both technologies to manage your data and distribute it across the organization’s departments.
Recommendation: You can utilize both technologies as they support the same idea, but serve different purposes. Data marts can be implemented as a part of a data warehouse for security, data aggregation, or accessibility. Or you can use data marts as a representation of several dimensions of the OLAP cube. But keep in mind that both data marts and OLAP cubes will require separate database setups.
Combined version with OLAP cubes and data marts
Now that we’ve covered what BI infrastructure is comprised of, let’s finally talk about how to implement it in your organization.
Business intelligence implementation
The process of BI adoption can be broken down into the introduction of business intelligence as a concept for your company employees and the actual integration of tools and applications. Let’s explore the main stages.
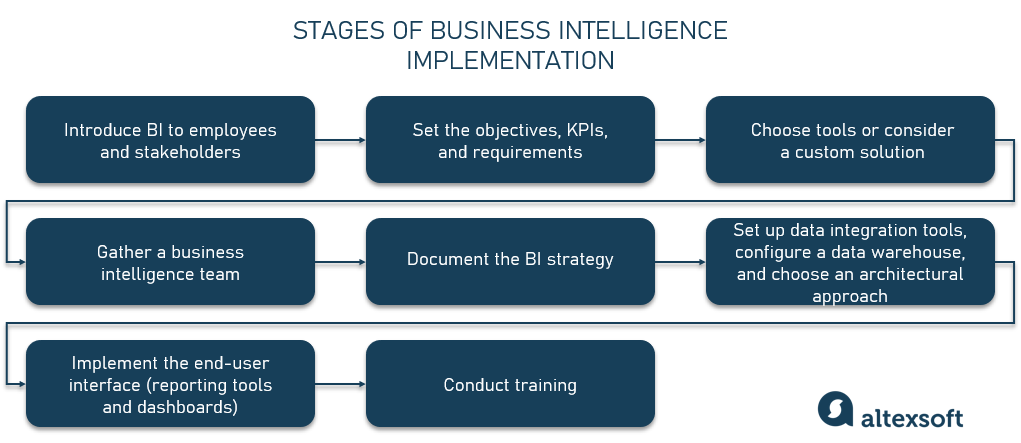
A scheme of business intelligence implementation
Step 1: Introduce business intelligence to your employees and stakeholders
To start utilizing business intelligence in your organization, first and foremost explain the meaning of BI to all your stakeholders. How you go about it will depend on the size of your organization. Mutual understanding is vital here because employees of various departments will be involved in data processing. So, make sure that everybody is on the same page and doesn’t confuse business intelligence with predictive analysis.
Another purpose of this phase is to pitch the concept of BI to the key people involved in data management. You will have to define the actual problem you want to work on and organize the required specialists to launch your business intelligence initiative.
It’s important to mention that at this stage, you, technically, will make assumptions about the sources of data and standards set to control the data flow. You’ll be able to verify your assumptions and specify your data workflow at the later stages. That’s why you must be ready to change your data sourcing channels and your team lineup.
Step 2: Set the objectives, KPIs, and requirements
The big step after aligning the vision is defining what problem or group of problems you are going to solve with the help of business intelligence. Setting the objectives will help you determine further high-level parameters for BI such as:
- What sources of data will be used? (CRM, ERP, website analytics, external sources, etc.)
- What type of data do you need to source? (sales numbers, reports, website traffic, etc.)
- Who needs access to this data? (top management, market analysts, other roles)
- What types of reports are required and how must they be presented? (spreadsheets, diagrams, ad hoc reports, or interactive dashboards)
- How will progress be measured?
Along with the objectives, at this stage, you will have to think of possible KPIs and evaluation metrics to see how the task is accomplished. Those can be financial restraints (budget applied to development) or performance indicators like querying speed or report error rate.
By the end of this stage, you must be able to configure the initial requirements of the future product. This can be a list of features in a product backlog consisting of user stories or a more simplified version of this requirement document. The main point here is that, based on the requirements, you should be able to understand what architecture type, features, and capabilities you want from your BI software/hardware.
Step 3: Choose tools or consider a custom solution
Compiling a requirement document for your business intelligence system is a key point to understanding which tool you need. For large businesses, building their own custom BI ecosystem can be considered for several reasons.
- Enterprise-level organizations may not entrust their valuable data to a third party.
- A bespoke solution is always more customizable and better tailored to your specific business needs than a ready-made one. Besides, BI tools often differentiate by serving the needs of some specific industry. There might not be a vendor on the market that provides services for your industry.
- You may have higher flexibility in terms of choosing a cloud infrastructure provider.
However, the obvious downside to building a custom BI infrastructure is the cost and length of the project.
So based on the requirements, industry type, size, and needs of your business, you will be able to understand whether you are ready to invest in a custom BI tool. Otherwise, you can choose a vendor that will bear the implementation and integration burden for you.
Currently, the BI market offers a great number of tools that are available both as on-premises versions and cloud-based (Software as a Service). It’s possible to find options that cover nearly any kind of industry-specific data analysis with flexible possibilities. Some of the criteria you might want to consider when choosing the right tool are ease of use, range of reporting and visualization options, built-in AI capabilities, connectivity, deployment flexibility, data shareability, etc.
Step 4: Gather a business intelligence team
The next step would be gathering a group of people from different departments of your company to work on your business intelligence strategy. The lineup of your BI team should include two main categories of people.
Domain representatives from different departments. These people will be responsible for providing the team with access to data sources. They’ll also contribute their domain knowledge to choosing and interpreting different data types. For instance, a marketing specialist can define whether your website traffic, bounce rate, or newsletter subscription numbers are valuable data types. Meanwhile, your sales representative can provide insights into meaningful interactions with customers. On top of that, you will be able to access marketing or sales information via a single person.
BI-specific roles. The second category of people you want on your team is BI-specific members that will lead the development process and make architectural, technical, and strategic decisions. So as a required standard you will need to determine the following roles.
- Head of BI. This person must be armed with theoretical, practical, and technical knowledge to support the implementation of your strategy and actual tools. This can be an executive with knowledge of business intelligence and access to data sources. The Head of BI is a person that will make decisions to drive implementation.
- BI engineer. A technical team member, this person specializes in building, implementing, and setting BI systems. Usually, BI engineers have software development and database configuration background. They also must be well-versed in data integration methods and techniques. A BI engineer may lead your IT department in implementing your BI toolset.
- Data analyst. This individual will provide others with expertise in data validation, processing, and data visualization.
Step 5: Document your BI strategy
Once you have a team and you’ve considered the data sources required for your specific problem, you can start developing a BI strategy, using traditional documents such as a product roadmap. Business intelligence strategy may include various components depending on your industry, company size, competition, and business model. Here are the recommended ones.
Data sources. This is documentation of your chosen data source channels, both external and internal.
Industry/custom KPIs. Documenting standard KPIs of your industry as well as your specific ones may open the fullest picture of your business growth and losses. Ultimately, BI tools are created to track these KPIs, supporting them with additional data.
Reporting standards. At this stage, define what kind of reporting you require to extract valuable information conveniently. In the case of a custom BI system, you may consider visual or textual representations. If you have already chosen the vendor, you may be limited in terms of reporting standards, as vendors set their own. This section may also include data types you want to deal with.
Reporting flow type and end users. An end user is a person who will observe data through the interface of the reporting tool. There are two main approaches to building a reporting flow.
- Traditional BI. A traditional BI flow requires technical staff as an intermediary between the reporting tool and the end user (which is usually a manager or executive). If an end user wants to extract some data, they have to make a request and tech staff will generate a report from the required data. In this case, your IT department acts as a power user, a user that can access data and influence its transformation.
This approach offers a more secure and controlled data flow. But relying on the IT department may introduce a lag in flexibility and speed in case of processing large amounts of data (especially for big data). Besides, it often puts analytical results solely in the hands of executives, restricting access for other employees.
- Self-service BI. Today, modern companies and solution providers utilize self-service BI, democratizing access to data. This approach allows business users and executives alike to get the reports generated by the system. Automated reporting doesn’t need power users (admins) from IT to process each request to your data warehouse (though the technical staff is still required to set up the system).
Automation may lower the quality of the end reports and their flexibility as it will be limited by the way the reporting is designed. But, as a benefit, the self-service approach doesn’t require actual technical staff to operate the system all the time. Users that are not tech-savvy will be able to create a report for themselves or access a dedicated section of the data storage.
Step 6: Set up data integration tools, configure a data warehouse, and choose an architectural approach
We’ve already discussed the technical part and the main approaches to configuring your data architecture for BI purposes in the previous section. The integration phase of the actual tools will most probably require a lot of time and work from your IT department.
There are multiple structural elements of a BI architecture you will have to develop in case you want to create a custom solution for your business. In other cases, you are always free to choose a vendor from the market that would carry out implementation and data structuring for you.
Step 7: Implement the end-user interface: reporting tools and dashboards
Molded into digestible, thematically related chunks of information (if you go with OLAP cubes or data marts), data is finally presented via a user interface of BI tools. In the past, business intelligence could produce only static reports, based on future and past events. Today, BI is capable of producing interactive dashboards and visualizations with customizable portions of information. BI providers continuously expand the range of graphical tools available in their products to fit different user needs.
The most valuable way of presenting information is considered ad hoc reporting, which is becoming more widespread due to natural language processing capabilities included in many BI tools. Ad hoc reporting allows users to quickly generate reports on an as-needed basis to get the answer to a specific question (e.g., “How did our hotel’s RevPAR change over the last month?”).
Step 8: Conduct training for end users
To smooth the onboarding process for your employees, we strongly recommend conducting training sessions. Those sessions may have a different form: If you use an embedded analytical tool in your CRM or ERP, you can employ onboarding practices like video hints or interactive onboarding tools that lead users through steps.
If you don’t have a budget to automate training, you still have to take care of educating your staff, for example, with the help of a manager or members of your BI team. Otherwise, your employees won’t be able to use the BI toolkit properly and extract value from data – which offsets the purpose of adopting BI.
BI testing and maintenance
Once you're set up and running, remember to assure the quality of the developed infrastructure and reports you generate. If you neglect ongoing testing and maintenance activities, you’ll end up with erroneous reports and inaccurate analytics results.
So you have to evaluate every step that data takes before the report is created and make sure all the elements of the infrastructure function properly.
- Assess data at its sources and verify that preparation and cleaning are done correctly.
- Check the ETL pipeline and all the connections between systems, making sure that data is transformed and loaded properly (e.g., there is no duplicated or missing information).
- Validate generated reports and dashboards, checking their readability, interactivity, customization options, accessibility, printability, etc.
You might also want to test other system capabilities like error reporting, failure recovery, scalability, performance, and so on.
The bigger and more complex your BI ecosystem is, the more robust your BI testing should be. Learn more about QA in software development and QA best practices in our related posts.
Key business intelligence tools on the market
It’s important to mention that BI tool providers usually supply users with data integration, ETL, reporting tools (dashboards), as well as warehousing services. It means that, most often, you can get the whole BI architecture integrated into your system. Here are some examples of business intelligence tools providers.
Microsoft Power BI
Microsoft Power BI, a recognized leader in the BI tools market, holds this position for the 16th consecutive year. It puts an emphasis on self-service, empowering teams and individuals to get value from data. Power BI leverages data marts to perform relational database analytics and utilizes ML techniques to uncover patterns and dependencies within datasets.
You can read a detailed Power BI overview in a dedicated article.
Tableau
Tableau is a cloud-based BI solution that pioneered drag-and-drop interfaces for reporting tools. Tableau software also has collaborative features: A single sign-in page can be created for your analysts to access the dashboard and share the information. You can query the data to be sent to your mobile device. A dedicated Tableau application can modify reports and save changes right from your phone.
Learn more about Tableau BI tools from our blog post.
Zoho Analytics
Another big name in the business intelligence industry is Zoho Analytics. It offers a full infrastructure for both small and large businesses with a scalable interface. Among its useful features, are open RESTful APIs to connect all your required CRS and ERP systems, as well as collaborative workspaces to share with your employees or stakeholders.
Sisense
Sisense offers back-end and front-end access to data analysis systems for users of different technical levels. It also provides data storage services, making it a one-stop solution. The pricing model is a yearly subscription, but the fees vary depending on the number of users, amount of data, and type of project.
SAP
SAP is an international company that offers many technical solutions, including SAP BusinessObjects Business Intelligence suite and Analytics Cloud. The platform supports smart querying and ad hoc reporting. The analytical dashboard can be set up depending on the user’s role. The cherry on top is the ability of SAP products to easily integrate with Microsoft Office products.
BusinessQ
BusinessQ offers BI solutions tailored specifically for small and medium-sized businesses. It provides both a standalone web application and an embedded version to be built into your own application.
Domo
Domo BI platform is a cloud-first solution, aimed at businesses of all sizes. The service is scalable, allowing it to work with big data or small corporate databases. Domo offers access to real-time dashboards, using data marts implemented on OLAP cubes to allow multidimensional analysis and data dedication by departments.
Qlik
Qlik is a business intelligence provider that offers various products for data visualization, interactive dashboarding, and self-service reporting. The infrastructure can be implemented in a cloud or on-premises. Additionally, Qlik offers access to a list of public datasets to source information.
This list is definitely not exhaustive. There are many other big names like Oracle, Amazon, Google, and IBM that also offer potent BI toolkits to streamline your business analytics.
BI adoption challenges
Despite its many benefits, business intelligence still isn’t universally adopted due to several challenges.
Lack of understanding and unwillingness to change. Many business owners still don’t see the value of BI and are reluctant to invest in developing the infrastructure. And even if they do, it often takes a lot of time and effort to create a data-driven culture on the enterprise level, explain its importance to employees, and have them adopt a new way of doing things.
Lack of skills. BI implementation is a big project that requires the engagement of skilled tech specialists that many companies don’t have onboard.
Fear of self-service. Some company owners tend to stick with the traditional approach and keep all the data in their own hands. Empowering teams and individuals is seen as inviting various data security risks.
Inconsistent data governance. Data governance is about establishing organizational policies, processes, roles, standards, and metrics that ensure the accuracy, consistency, security, and availability of data. It helps avoid errors when using data, facilitates access, ensures compliance, and much more. So it’s essential to implement a proper data governance strategy.
Business intelligence real-life examples
To give you a pinch of inspiration and end on a positive note, we’ll take a brief look at some real-world examples of successful BI implementation.
Starbucks, a global coffeehouse company, benefits from BI and data analytics in a number of ways. It collects massive amounts of sales and customer behavior data to improve its marketing campaigns, create personalized offers (e.g., offering unsweetened drinks to those who skip the sugar), develop new products, choose locations for new shops (by monitoring population density, traffic, etc.), and much more.
Lufthansa, one of the biggest European airlines, partnered with Tableau to standardize and automate its reporting processes. As a result, data preparation time was reduced by 30 percent. Actionable analytics results became available not only to decision-makers but also to business users due to self-service BI.
One of the leading US fast-food companies, Chick-fil-A, implemented a BI solution after discovering that it loses 100,000 hours of productivity per year because of data searches. The new tool made it easy for all business users to search the required data and quickly uncover the insights themselves, freeing up data analysts for higher-value add tasks.
Today, self-service BI has become a standard for average business tasks, allowing entrepreneurs to conduct analytics more cost-effectively. Business intelligence is no longer an executive privilege. It's a collaborative tool for your whole organization. Make sure you pick the right vendor and include all the necessary features to help your employees access those insights.


