Data is like contaminated water. It may be incomplete, inaccurate, untimely, un-integrate-able, and unprotected – or at least one of these things. If your management knew the truth about the water, err… data problems, do you think they’d drink from that source?
When discussing the value of data in today's world, we often call it the "new oil." However, a comparison to water is more fitting. We can't live without water, but only pure water is valuable. The same goes for data — it must be cleaned before you can use it in business. "Dirty data" can do more harm than good.
This article will explain why data cleaning is essential and describe how it works in practice.
Data cleaning is one of the key steps involved in master data management. Learn more in our dedicated article with examples.
What is data cleaning?
Data cleaning, also called data cleansing, is the process of identifying and fixing issues like corrupt, incomplete, incorrectly formatted, or duplicate data. If some data items can't be corrected, they may be deleted or replaced with new ones.
There are two basic use cases for data: transactional and analytical. Transactional data usage supports day-to-day operations and business processes in near real-time. For example, when a customer pays for a meal delivery, the app accesses the database, checks the meal's price, and deducts that amount from a credit card. A shipment tracking program uses real-time satellite data to monitor a container ship's position at sea. And so on.
Analytical use of data, on the other hand, helps us make decisions and plan for the future. For instance, you might analyze data to find the average price of meal orders to decide on a pricing strategy. Although data quality is important in both cases, data cleansing is particularly relevant when using data for analytics to ensure accuracy and reliability in decision-making.
Data cleaning can be done manually if the dataset is small and straightforward, but it's usually done using software tools or coding languages. The cleansing approach depends on the data's initial quality and the kind of analysis it will be used for.
Data cleaning process in data preparation
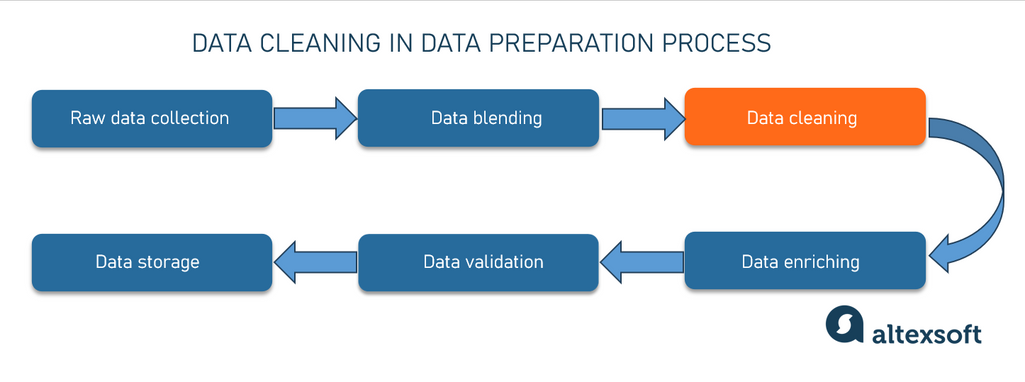
Every modern business bases its decisions and strategies on data analysis. However, raw information alone has no real business value unless it is properly prepared, structured, and interpreted. Data cleaning is a necessary part of the data preparation flow for analysis. Let’s see what data prep entails.
- Raw Data Collection — gathering raw data from various sources: images, tables, text files, web pages, video files etc.
- Data Combining — blending data from multiple sources into a functioning dataset.
- Data Cleaning — correcting errors, and fixing inconsistencies to ensure data quality.
- Data Enrichment — enhancing existing data by adding information from external or internal sources.
- Data Validation — exploring data to make sure it is correct and meets the initial analysis requirements.
- Data Storage — saving data in a warehouse.

Six steps of the data preparation process
Data cleaning, much like the whole data preparation process, falls under the responsibility of data analysts, data scientists, and data engineers. A data analyst, the primary data user, must understand what’s required for analysis: the data types, quality, origin, volume, and so on. If the dataset is relatively small, it's not unusual for the data analyst to handle the entire process of preparing the raw data. This can include extracting data from various sources and ultimately presenting it through reports and graphs.
Here you can read an article about how to structure a data science team and the key models and roles to consider. Also, you can watch our video explainer.


But suppose the company works with large data sets. In that case, it is impossible to prepare data without automation, and data engineers (in particular, ETL developers) should be involved in the process. The data pipeline “sucks” data from various sources, runs it through all stages of preparation, and stores cleaned data in the data warehouse, from where it can be accessed for analysis. However, the data analyst or data scientist always remains the conductor of the data orchestration process, the one who pays the piper and calls the tune, i.e. defines the parameters that the prepared data should correspond to.
Data cleaning vs data wrangling
Data cleansing is often confused with data wrangling. While the distinction may seem minor, there is a difference between the two. Data cleaning primarily involves detecting and correcting errors in datasets, whereas data wrangling focuses on transforming data into a more suitable format for an application or algorithm. This often means converting raw data into a desired format through merging, grouping, concatenating, etc.
While data cleaning enhances data accuracy and integrity, data wrangling structurally prepares data for use, such as for analysis or model building. Typically, data cleaning is considered a step in the wrangling process.
Characteristics of clean data
When you hire a team of professional house cleaners, you might just ask them to make everything sparkle. But to assess data quality, you need more precise and measurable criteria.
- Accuracy -- Records must be correct and true.
- Completeness -- Data should be complete, with no missing or partially completed fields. All needed data sets and items should be included.
- Consistency -- Data sets should be matchable across all systems and databases.
- Relevance -- The information should be up-to-date, reflecting recent changes.
- Uniformity -- All inputs should be standardized in a single format, such as a uniform style of recording dates or a format for numbers.
Using these metrics, data teams can assess the quality of the datasets.
Benefits of data cleaning
No matter the business domain, data cleansing offers the following benefits:
Better operational performance. With accurate and verified information at their disposal, teams can focus on meaningful tasks instead of dealing with data issues.
Enhanced data security. If a bank's database has a client's outdated phone number, an SMS to confirm payments may be sent to this number, revealing sensitive financial information to a stranger. Data cleansing reduces the risk of such data breaches.
Effective analysis. Without clean data, accurate and in-depth analysis to correctly identify patterns, trends, and correlations is impossible.
Better use of data for decision-making. A simple example: An eCommerce company redesigns its website. It conducts AB testing before launching the new version, showing two different segments of users two versions of the site and collecting data like conversion rates. If data is corrupted, the less successful version might be chosen, potentially leading to a drop in sales. That brings us to the next point.
Cost savings. According to the technology research firm Gartner, poor data quality costs US enterprises an average of $12.9 million annually, with a nationwide annual total of $3 billion.
Compliance and regulation. Additionally, by preserving correct data, organizations can avoid fines that might be levied for violating data regulations, such as the Gramm-Leach-Bliley Act (GLBA) which applies to financial institutions, or the Federal Information Security Management Act (FISMA).
Data cleaning steps and techniques
Techniques for maintaining data quality vary widely depending on the type of data your company stores and the task at hand: cleaning an address book, reporting on a marketing experiment, or preparing quality input data for machine learning models. Because of this, there's no one-size-fits-all approach or universal template for the data cleaning process. However, you can focus on common issues that frequently arise in data collection and storage. To ensure data quality, you must either prevent these issues from occurring in your dataset or address them when they do.
Therefore, the first step is always the same: Examine the data, explore what you have, and use your domain knowledge and professional intuition to identify problem areas. There could be hundreds of them, but we will focus on just a few of the main types of “dirty data” and how to deal with them.

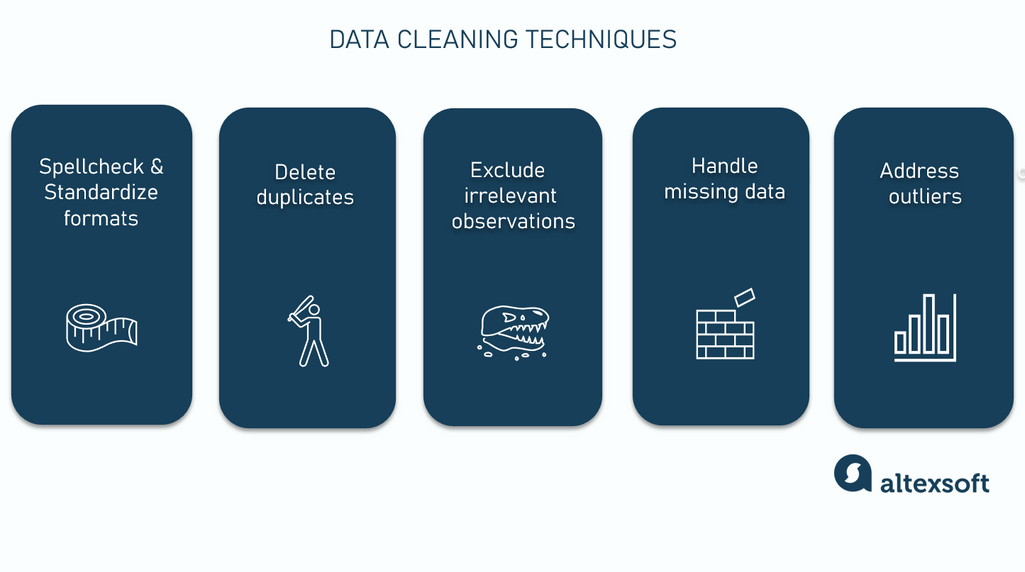
The basic data cleaning techniques
Spellcheck and standardize formats
One of the most common and obvious issues you'll notice right away in a dataset is naming errors and typos. For example, if not corrected, "New Yrok" and "New York" will be treated as two different cities and end up in separate rows.
Another major problem is format mismatch. If employees from different continents enter measurements like weight and distance in the shared table, you might find pounds mixed with kilograms and kilometers mixed with miles in the same dataset. It's important to standardize these inconsistencies by choosing a single format for the data.
The same applies to date formats. Sometimes, dates in a dataset might be in the American format (MM/DD/YYYY), while others are in the European format (DD/MM/YYYY).
If your dataset includes telephone numbers, make sure they're all in the E.164 format, an international standard defined by the International Telecommunication Union (ITU). For example, a US phone number in local format might look like (415) 555-2671, but in E.164 format, it should be +14155552671.
Another common issue is using commas instead of dots for decimal points. Be sure to use dots, not commas!
After understanding how numerical data should be presented, ensure that categorical values are also standardized. For instance, if the “Gender” column includes "Male," "male", "Female," "F", and "f" inputs, decide on a consistent format, like all uppercase or all lowercase, and standardize all entries (e.g., "Male" and "Female"). Also, choose a consistent way to represent place names. To avoid confusion, using the full country name rather than an abbreviation is easiest (the Democratic Republic of the Congo instead of Congo; New Zealand instead of the initialism NZ).
Delete duplicates
Data duplicates occur due to errors in data entry, data integration from multiple sources, or lack of proper data validation mechanisms. Additionally, inconsistencies in data formatting and synchronization issues between databases can create duplicate records.
To handle them, you must determine which columns should be considered to identify duplicates. For example, duplicates might be defined by the same combination of name, email, and age. Then mark or flag them. In tools like Excel, you can use conditional formatting to highlight duplicates. In Python, the Pandas library offers methods like “duplicated()” to identify duplicates. After that, you must decide how to handle the issue:
- delete all rows that have duplicates,
- keep the first or last occurrence of each duplicate and remove the others, or
- combine data from duplicate rows in some meaningful way, such as averaging numeric fields or concatenating text fields
When deleting duplicates, it's a good idea to backup of the data in case you accidentally delete something you need.
Exclude irrelevant observations
Irrelevant records don’t fit the specific problem you’re trying to solve. Start by identifying and defining criteria for relevance based on the requirements of your analysis.
If in doubt, it's best to ask the customer who will be using the dataset. You may not know how the data was collected or who input it, but it’s crucial to understand the intended purpose to ensure quality data
Then, systematically filter out or remove records and fields that don’t meet these criteria, ensuring that only pertinent data is retained for further processing and analysis.
Handle missing data
In some cases, missing entries are normal. Consider a survey conducted by a retail company to assess customer satisfaction with its service. The demographic questions are optional, and their absence doesn't negate the core analysis.
In many other cases, an empty cell means that someone made a mistake when entering the data, or the information got lost somewhere along the way -- during storage or transformation of the dataset. So first figure out if empty cells or columns are an anomaly. If not, they can simply be dropped. If yes, it is necessary to fill them in. Some possible options are:
- take additional information from an external data source,
- substitute average values for missing ones, or
- calculate missing values based on the available data (say, if there is a total and a unit price, you can calculate the number of units sold).
These decisions should only be made again after talking to the end user of the dataset. And remember that many algorithms refuse to work with missing values.
Address outliers
An outlier is a data point that significantly differs from other observations in a data set and skews the analysis results.
Sometimes they are just errors. Let's consider an example from AltexSoft’s experience. Analyzing an airline's sales table, we noticed that tickets purchased on the same day for the same flight in the same class differed significantly in price: In one case, the ticket cost was twice as high as other tickets. After consulting the client, we found that the price for two tickets was mistakenly recorded as one.
Outliers can occur due to data variability. Imagine you’re an analyst in the corporate travel management department, budgeting for employee flights for the upcoming quarter. You have to predict air ticket prices, but the exact numbers are uncertain due to the dynamic nature of airfares. Your dataset shows roundtrip prices ranging from $1,200 to $4,000, depending on departure dates, destinations, and times. However, there's one $40,000 flight because your CEO had to urgently leave a country amid rising hostilities, with fares skyrocketing, the only available seat being first class on the last plane out before the airspace closed. While the price is accurate, it's an outlier, so you'd likely exclude it from your analysis.
Sometimes, however, an outlier can actually support the theory you're working on. Take the discovery of the Higgs boson — the missing piece in the Standard Model of particle interactions. In 2012, it was identified due to deviations from expected particle trajectories. Imagine a physics experiment at CERN's Large Hadron Collider, that monitors tens of millions of particle collisions every second. Each event generates about one megabyte of data, totaling approximately 40 terabytes per second while the collider is running! Detecting abnormalities in such a massive amount of data was only possible using AI.
In smaller datasets, visualization tools and statistical methods can be used to identify data points that significantly deviate from the mean. An unusual peak on a normal distribution plot might indicate that a value was entered incorrectly or an error occurred during data conversion.
Check the data type in each column. If a column should contain percentages, any values less than 0 or greater than 100 are outliers. Similarly, if a column represents a person's age, values like "-3" or "158" would be outliers.
Once you have determined whether the abnormalities are genuine or errors, select a strategy to address the issue.
- Remove outliers, if they are errors or irrelevant to your analysis, but be cautious, as this can sometimes lead to the loss of valuable information.
- To minimize outlier impact while retaining its information, you can use the clamping technique: Set a minimum and maximum threshold, so any data values below the minimum threshold would be replaced with the minimum value, and any data values above the maximum threshold are replaced with the maximum value.
- Apply transformations such as a log or a square root to reduce the effect of outliers.
- Choose statistical methods less sensitive to outliers, like median and robust standard deviations.
Keep detailed records of how and why you identified and treated outliers. This documentation is vital for transparency and reproducibility.
Once all problems have been identified and, if possible, corrected, the final step of data cleaning should be verification. Review summary statistics, ensure the data meet the criteria you initially adopted, check via visualization if the deviations have smoothed out, and compare a random sample of cleaned records with the original data to ensure correct changes.
Data cleaning tools and how to choose them
Finding the perfect data cleaning tool can significantly streamline your workflow. Here’s a quick overview of what to consider to make an informed decision.
Manual data cleaning
Manual data cleaning is challenging because it's a tedious process prone to error. First, it can be incredibly time-consuming, especially with large datasets. Second, the repetitive nature of the task can lead to fatigue and reduced concentration over time. Besides, some data issues may be complex and not easily identifiable. Unsurprisingly, cleaning and organizing data is considered the least enjoyable part of data science — according to the Omaha Data Science Academy, 57 percent of professionals hate this task.
Nevertheless, manual data cleaning can be viable for small to medium-sized data volumes. Excel or Google Sheets are good enough to keep a local travel agency's client base and accounting in order. In both tables, you can filter data and sort by ascending or descending. Upper/Lower/Proper functions change text case. Ctrl+F (search) and Ctrl+H (replace) key combinations allow you to find and replace records quickly. The name of the Remove Duplicates function in the Data tab speaks for itself. And more or less the same features can be found in Microsoft Power BI, which is sometimes called Excel on steroids for a reason.
However, dataflow automation is indispensable on larger projects in any industry, from travel to eCommerce, banks, and tech companies. So, how can data cleaning be automated?
Ready-made tools that don’t require coding
If a company's data team has no data engineers, and its data analysts don't have the programming skills to handle data quality assurance, ready-made software will come in handy.
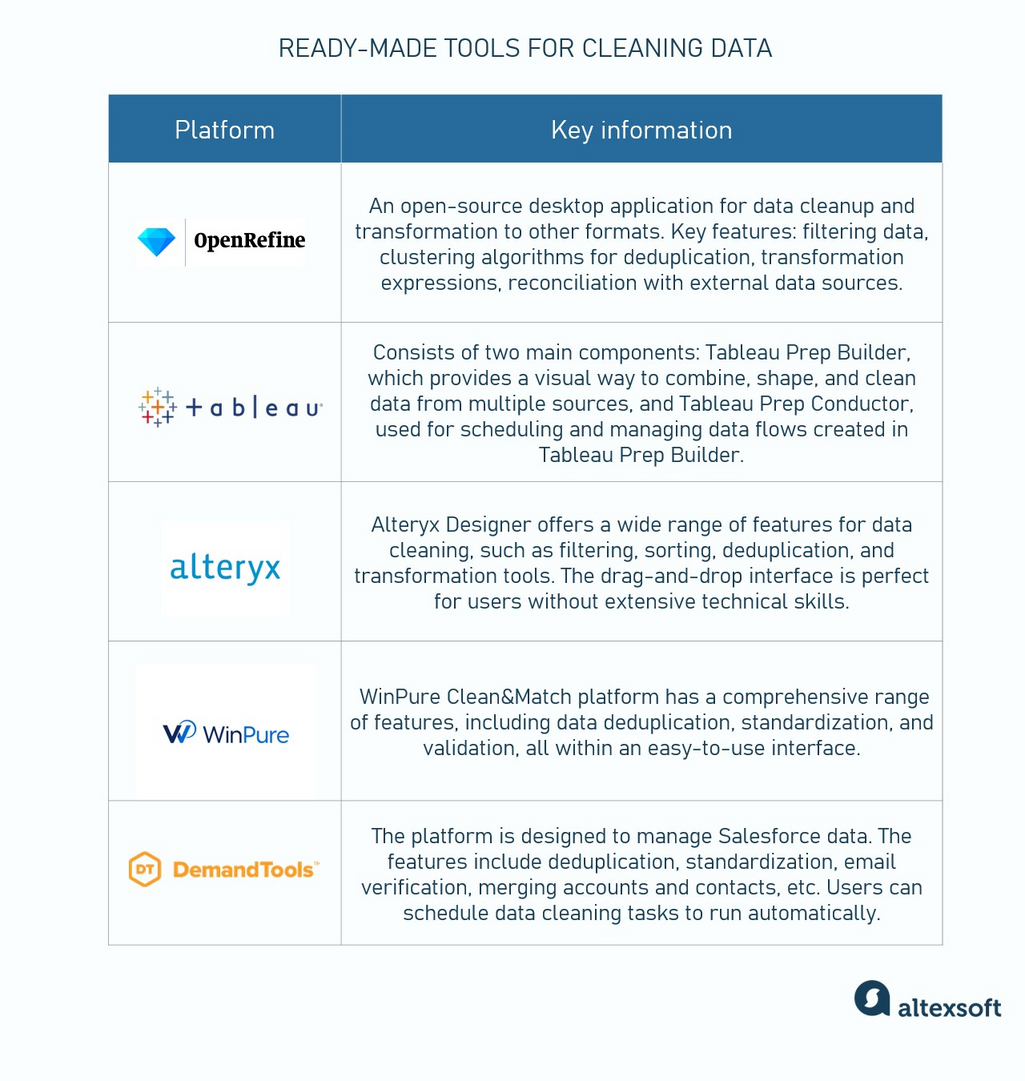
Here you have 5 tools that provide the most convenient functionality for data cleaning without requiring profound coding expertise.
OpenRefine. An open-source desktop application for data cleanup and transformation to other formats, its key features are faceting and filtering data, clustering algorithms for data deduplication, transformation expressions, and reconciliation with external data sources.
Tableau Prep. It is designed explicitly for data preparation and cleaning. It consists of two main components: Tableau Prep Builder, which provides a visual and direct way to combine, shape, and clean data from multiple sources, and Tableau Prep Conductor, used for scheduling and managing data flows created in Tableau Prep Builder. It ensures that data cleaning is automated and consistently executed.
Alteryx Designer. The product offers a wide range of features for data cleaning, such as filtering, sorting, deduplication, and transformation tools. The drag-and-drop interface is perfect for users without extensive technical skills. Alteryx also includes automated data profiling capabilities that help users quickly understand their data, identify anomalies, and detect patterns needing attention.
WinPure Clean&Match. This platform has a comprehensive range of features, including data deduplication, standardization, and validation, all in an easy-to-use interface. The sophisticated fuzzy matching algorithms identify duplicates and inconsistencies, even in large datasets.
Validity DemandTools. This data quality platform is designed to manage Salesforce data, so it’s a good choice if your company relies on this CRM. The features include deduplication, standardization, email verification, merging accounts and contacts, etc. Users can schedule data cleaning tasks to run automatically, ensuring that data is regularly updated and cleaned.

These tools will help data analysts with no programming skills to handle data quality assurance
Big tools for big data
Database management systems (such as Oracle Database, Microsoft SQL Server, MySQL, etc.) and data pipeline products (such as Google Cloud Dataflow, Apache Spark, Microsoft Azure Data Factory, AWS Glue, Talend Data Integration, etc.) always include features related to data hygiene. Hundreds of companies produce such software, and the final choice depends on the tasks that a particular business and team of data engineers, data analysts, or data scientists face.
In real life, the question goes like this: What tools does the company already use? Oracle Database and Microsoft stack? Great, but do these tools have enough functionality to solve the specific data cleaning and preparation task? If not, perhaps additional features or tools must be purchased. Or you may need to write code yourself
Python libraries (Pandas, Dora, scrubadub, etc.) are best suited for users who are comfortable with coding and need a highly customizable and powerful instrument. Cleaning data with Python, SQL, or Java allows you to run routines for specific projects while keeping costs low.
“And if there is a lot of data, if the processing lasts a whole day, not every software can cope with such volume. When working with Big Data, you can't do without a powerful pipeline like Databricks, which integrates with various databases and the Apache Spark cloud computing platform,” — says Alexander.
Why data cleaning is essential: real-life example
Let's go back to the metaphor of data as water. Dirty water can be unpleasant, but not necessarily dangerous. Water containing bitter mineral salts or chalk may look cloudy and taste unpleasant, but it can still quench your thirst without causing illness. On the contrary, clear water can be dangerous if it contains harmful bacteria.
The same applies to dirty data: Sometimes errors have minimal impact on results, but other times, poor data hygiene can have severe consequences. "If there is a bug in the data collection or processing algorithm from the beginning, then all the results of data analysis will be incorrect, warped, or corrupted, even if they seem plausible," -- states Alexander Konduforov.
And one of the most dramatic stories to illustrate this stems from accounting errors at the British postal company, Post Office Limited. Due to bugs and data corruption, Fujitsu's Horizon accounting software incorrectly calculated amounts received from lottery terminals and ATMs, leading to apparent shortfalls that were blamed on Post Office employees. These massive software failures resulted in the wrongful conviction of more than 700 postal supervisors for theft and fraud between 1999 and 2015. The consequences were dire, including prison sentences, debt, bankruptcies, and several suicides.
Judicial and journalistic investigations into the case lasted for many years, sparking a huge public outcry. The story inspired a TV series, "Mr. Bates vs. the Post Office,” which premiered in early 2024. Since then, several other postmasters have appealed their convictions that have not yet been overturned. Another outcome of the scandal was that the British Computer Society, the organization for IT professionals in the UK, called for a review of the courts' default assumption that computer data is always correct.
It's hard to argue with that. Data is rarely 100 percent accurate. However, after reading this article, you can understand the importance of regular data hygiene and know where to start to achieve better data quality.

Olga is a tech journalist at AltexSoft, specializing in travel technologies. With over 25 years of experience in journalism, she began her career writing travel articles for glossy magazines before advancing to editor-in-chief of a specialized media outlet focused on science and travel. Her diverse background also includes roles as a QA specialist and tech writer.
Want to write an article for our blog? Read our requirements and guidelines to become a contributor.

