Over 64.2 zettabytes of data are created yearly, which is equivalent to about 15.4 billion movies of ultra-HD quality—something you could hardly watch even if you lived hundreds of lives.
Businesses are racing to collect as much of this data as possible. However, gathering the data is only the first step; effectively managing and organizing it is the real challenge. This is where a data warehouse comes into play.
Just as building a house requires a detailed blueprint, designing a data warehouse demands a solid plan. The architecture you create — via data engineering — serves as the foundation for enterprise analytics and business intelligence (BI), turning massive data into actionable insights.
This article will explore data warehouse architecture, how to build an efficient one, its key components, and best practices for success.
Master data management involves extracting data from source systems like data warehouses for procwssing and fine-tuning. Learn more in our dedicated article with examples.
What is a data warehouse?
A data warehouse (DW or DWH for short) is a centralized repository that stores large volumes of data from multiple sources — relational databases, CRM and POS systems, ERPs, external APIs, flat files, and IoT devices — for future analysis, reporting, and decision-making.
Unlike traditional databases, optimized for transactional operations, data warehouses are designed for querying and analyzing vast amounts of historical data to derive insights, track trends, and make informed decisions.
Some data warehouses are built for on-premise environments, meaning they are hosted and managed within the company's physical infrastructure. There are also cloud-based data warehouses like Amazon Redshift, Google BigQuery, and Snowflake.
Read our article on enterprise data warehouse to learn more about its core concepts, types, and compatible technologies.

What is data warehouse architecture?
Data warehouse architecture serves as the blueprint for data flows from its sources to end users, ensuring the information is properly integrated, organized, and accessible for analytics and reporting.
The data in the DW typically moves via either ETL (Extract, Transform, Load) or ELT (Extract, Load, Transform) processes. The choice between the two data pipelines impacts the architecture since it dictates where the transformation will happen — outside or inside the warehouse.
Read our article ETL vs ELT: Key Differences Everyone Must Know to understand how they work and which use cases they fit.
However, in both cases, DW architecture has four logical layers, each with its distinct purpose:
- data source or data integration layer;
- staging or transformation layer;
- storage or data serving layer; and
- presentation layer.
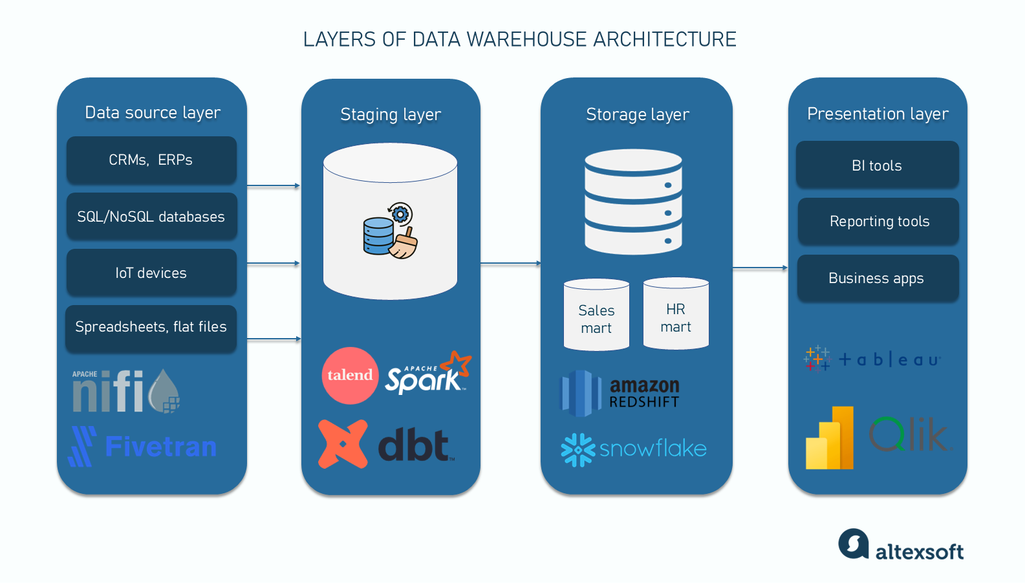
The names can differ from organization to organization, and there can be additional layers as the complexity of the system grows. Also, at each step, different tools will be used. Yet, the idea is always the same: working together, these layers ensure delivering accurate, timely, and meaningful insights from raw data.
Data source layer
The starting point for any data warehouse is its data sources. At this layer, the first phase of ETL/ELT — extract — happens. Traditional DWs only work with structured data (e.g., relational databases), while modern cloud-based data warehouses also support semi-structured (e.g., XML, JSON) and unstructured data (e.g., texts and multimedia files).
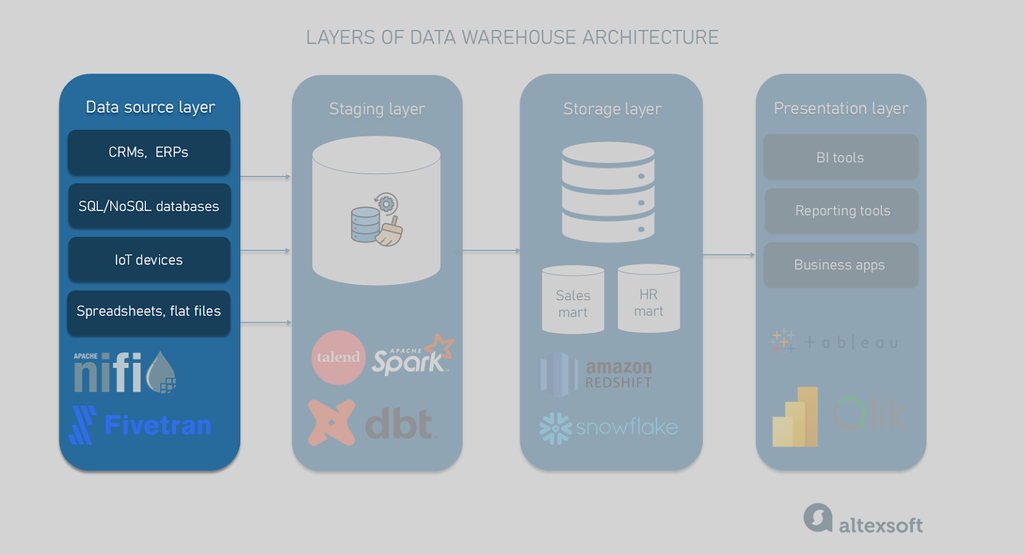
Tools commonly used for data extraction have pre-built connectors to various databases, file systems, business applications, etc. Their functionality goes beyond pulling data from its sources and includes transformation capabilities. Among popular instruments are Apache NiFi, Stitch, and Fivetran.
Staging (transformation) layer
This is where the ingested data is prepared for analysis. This layer ensures data integrity, quality, and consistency by applying a series of transformations such as data cleansing, type conversions, joining, and enrichment. The goal here is to organize raw data into a structure or model that meets the requirements of the next — storage — layer and is suitable for analysis.
Сreating the data model is part of the transformation layer; it’s not owned by that layer. Data models need to be stored and can also be the final presentation
The physical location of a staging area where raw data temporarily lives and undergoes transformation differs for the ETL and ELT pipelines. In the first case, it sits between data sources and the warehouse — for example, in Google or Amazon cloud storage. In the ELT process, transformation happens after loading data into the WH, so the staging area resides in a separate area inside the warehouse.
In both cases, after transformation the data is moved to the storage layer.
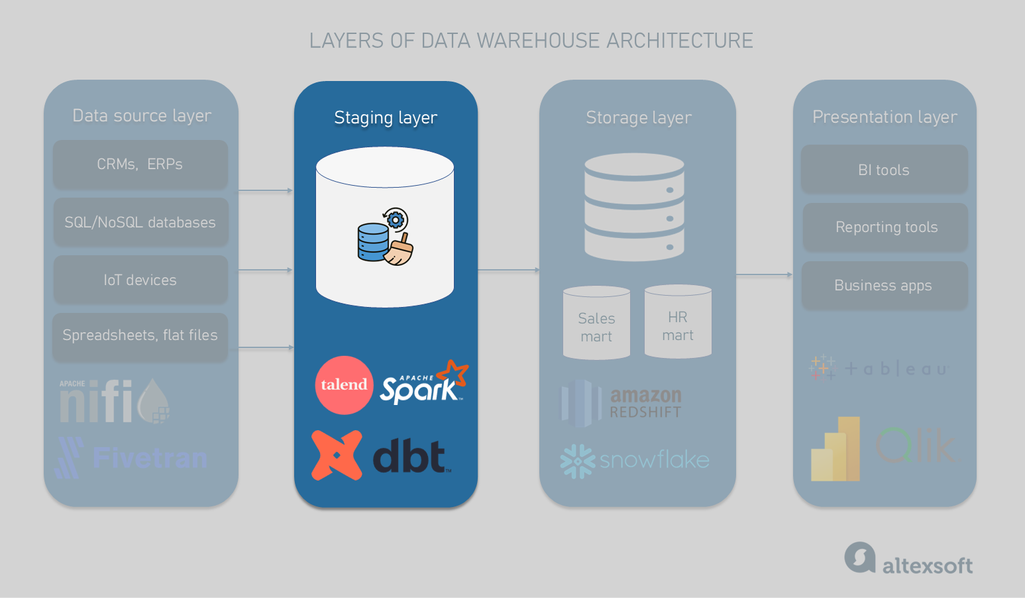
Tools commonly used to run transformations are:
- Apache Spark — for large-scale data processing;
- Talend — for a wide range of transformation operations;
- DBT (Data Build Tool) — for transforming data directly in the data warehouse using SQL; and
- AWS Glue — a serverless tool natively integrated with AWS storage services and simplifying transformations in both ETL and ELT scenarios.
Again, most of these platforms can perform data extraction — for example, Talend leverages over 1,000 connectors to data sources. Apache Spark provides connectors to the majority of popular SQL and NoSQL databases, file systems (like Hadoop distributed file system), cloud storage providers, and streaming data sources (Kafka, Kinesis, etc.) Yet, its main focus is complex data transformations and analytics at scale.


Storage (serving) layer
The storage layer inside the data warehouse keeps transformed data ready for analysis using tools of the presentation layer. Depending on the architecture approach, it can include data marts, which are subsets of the WH designed for the needs of a specific department, business area, or user group. Experts like data scientists, business analysts, and data analysts can directly query data marts.
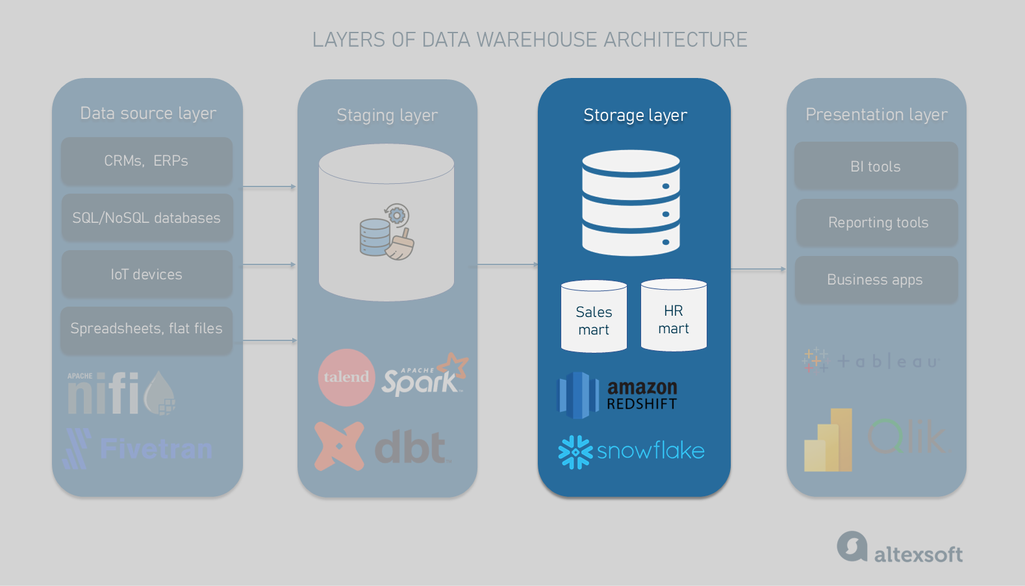
Popular options for the data storage layer include Amazon Redshift, Google BigQuery, Snowflake, and Microsoft Azure Synapse. All of them are scalable cloud-based platforms that support big data analytics.
Presentation layer
That’s where end users access and analyze data from the storage layer through friendly interfaces like reports, dashboards, and visualizations. In the background, analytical tools can run the OLAP (Online Analytical Processing) method that enables complex queries and multidimensional data analysis of large data sets.
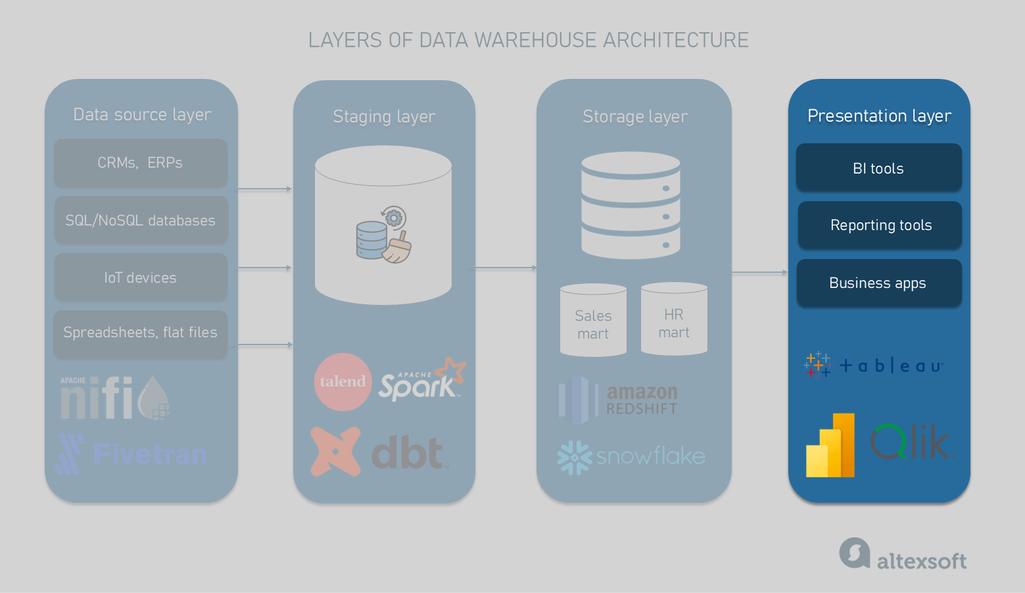
Business intelligence tools used for the presentation layer include Tableau, Power BI, Looker Studio, and QlikView.
Read our articles on pros and cons of Microsoft Power BI and Tableau BI tools to compare these platforms.
Data warehouse schemas
Data warehouse schemas organize data in a way that optimizes query performance, improves data integrity, and facilitates easy reporting and analysis.
There are three primary types of data warehouse schemas, each with its unique structure and use cases. Choosing the right one is crucial for the success of a data warehouse project.
Star schema
The star schema is one of the simplest and most commonly used warehouse schemas. It gets its name from the star-like appearance of its structure and consists of two types of tables:
- a fact table that contains quantitative data like sales revenue, quantities sold, or transaction counts. Each record in the fact table is associated with keys that link to its respective dimension table.
- dimension tables that surround the fact table. They hold descriptive information or metadata about the facts, like customer details and product categories.
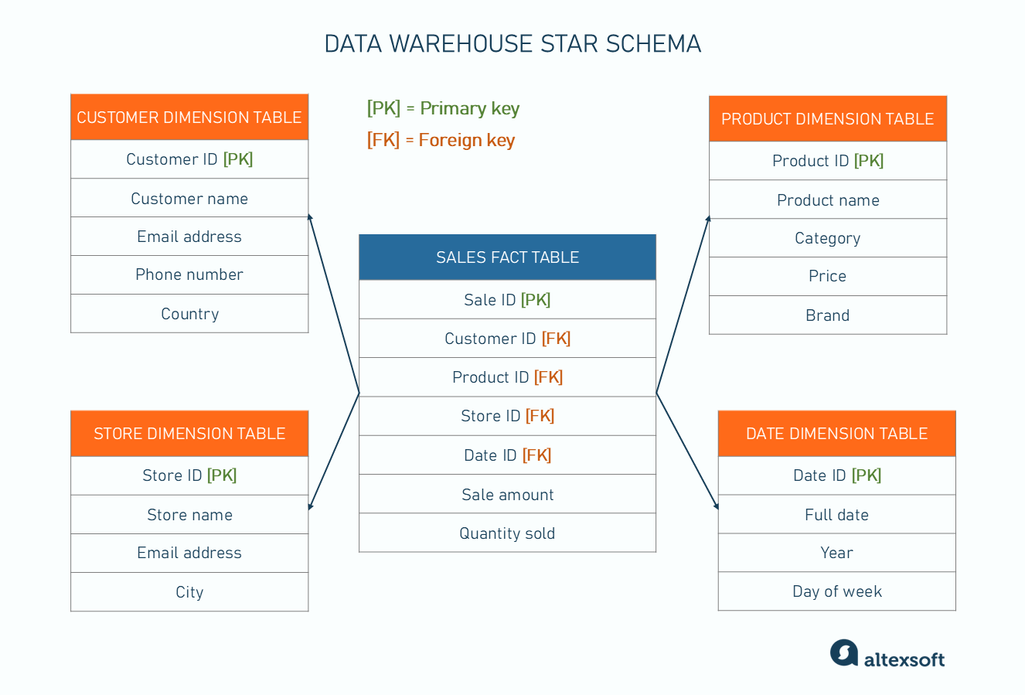
Data warehouse star schema. The primary keys (PK) are unique identifiers for each record in a table. They become foreign keys (FK) when used as a reference in another table
The star schema is easy to understand and use, making it accessible for technical and non-technical users. Its simple structure makes it highly efficient for querying and reporting, especially for large volumes of data.
Snowflake schema
The snowflake schema is a more complex variation of the star schema. Like the star schema, it starts with a central fact table containing the quantitative data but breaks the dimensions down into multiple tables.
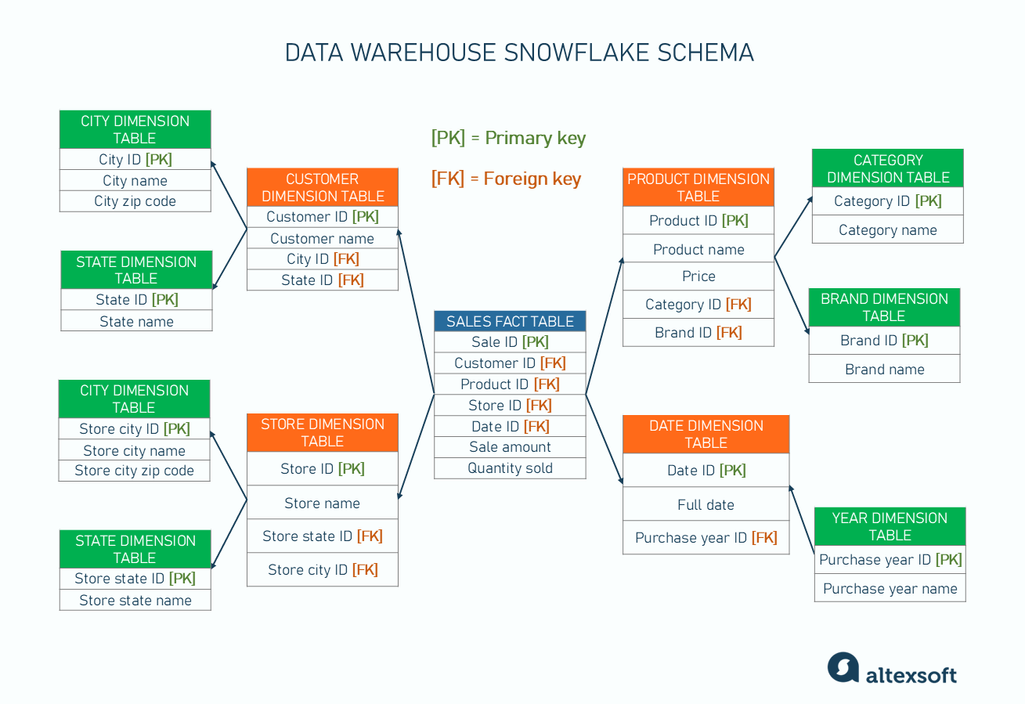
For example, in the product dimension, instead of storing all product-related attributes in a single table, the snowflake schema splits it into several related tables, like product categories, product types, and product brands.
Normalizing dimension tables and breaking them down into multiple related tables gives the schema its complex, branching structure that resembles a snowflake.
Data vault schema
The data vault schema, or data vault architecture, was created by Dan Linstedt in the 1990s to address the limitations of star and snowflake schemas, which struggle with the complexity and volume of modern enterprise data.
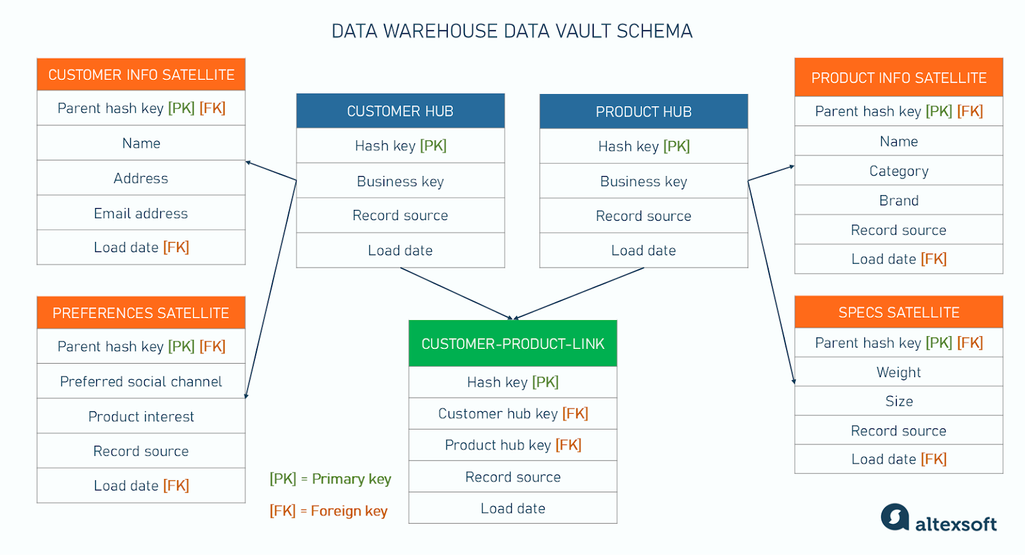
The data vault structure consists of three main components:
- hub tables that store unique business keys, like customer IDs or product IDs. They are the anchors of the data vault schema, representing core business entities.
- link tables that define the relationships between hubs. For instance, a link might connect a customer hub to a product hub, indicating that a specific customer purchased a product.
- satellite tables that hold the descriptive data and historical information associated with hubs and links. For example, customer satellites might contain details like name, address, or purchase history, while product satellites could store information like descriptions and prices.
Read our article on data vault architecture to learn more about this schema type, and how it compares with traditional warehouse schemas.
Technical implementation: approaches to building a data warehouse
Now, that we’ve explored logical layers and data schemas that make up a data warehouse, let’s explore major approaches to building a data warehouse and see how they influence the overall architecture.
Top-down approach
The top-down approach was introduced by Bill Inmon, an American computer scientist often called the father of the data warehouse. In this scenario, you first build the central data warehouse, which incorporates all key components and serves as the primary repository and single source of truth for all organizational data. After that, smaller, specialized data marts are created to serve individual departments.
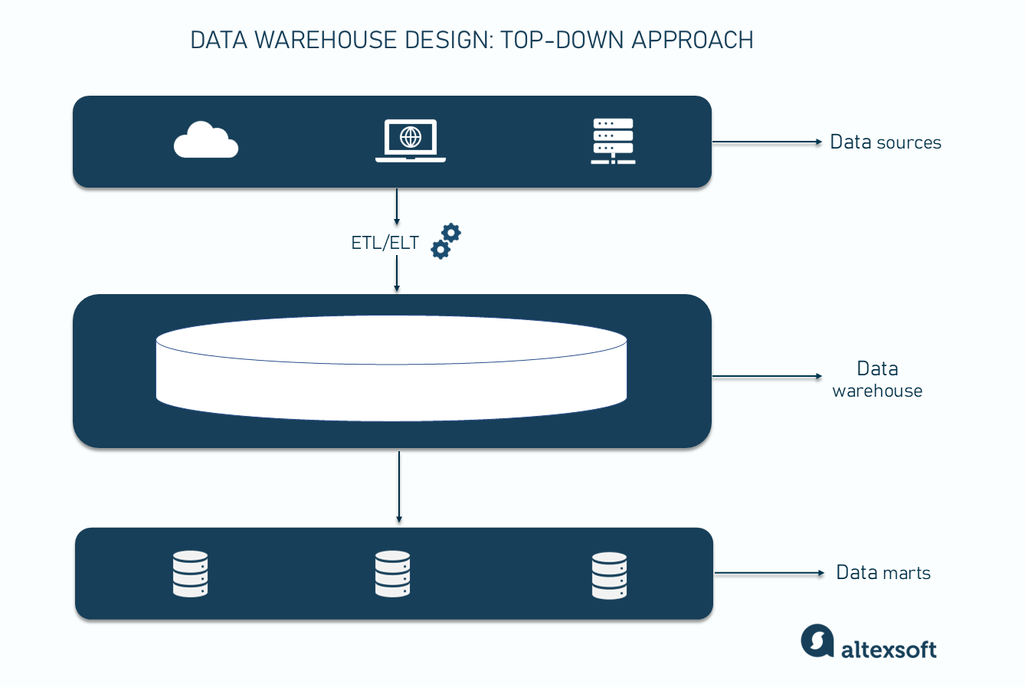
Pros. The top-down pattern ensures that all departments are working with the same data. This guarantees data consistency, eliminates redundancies, and prevents discrepancies in reports and analyses.
Cons. This approach can take a long time as the entire warehouse must be developed before it can be used.
Bottom-up approach
The bottom-up approach, championed by Ralph Kimball, another data warehousing pioneer, starts with creating data marts, which are later integrated into a centralized data warehouse. This method is more flexible and business-centric compared to the Inmon’s version.
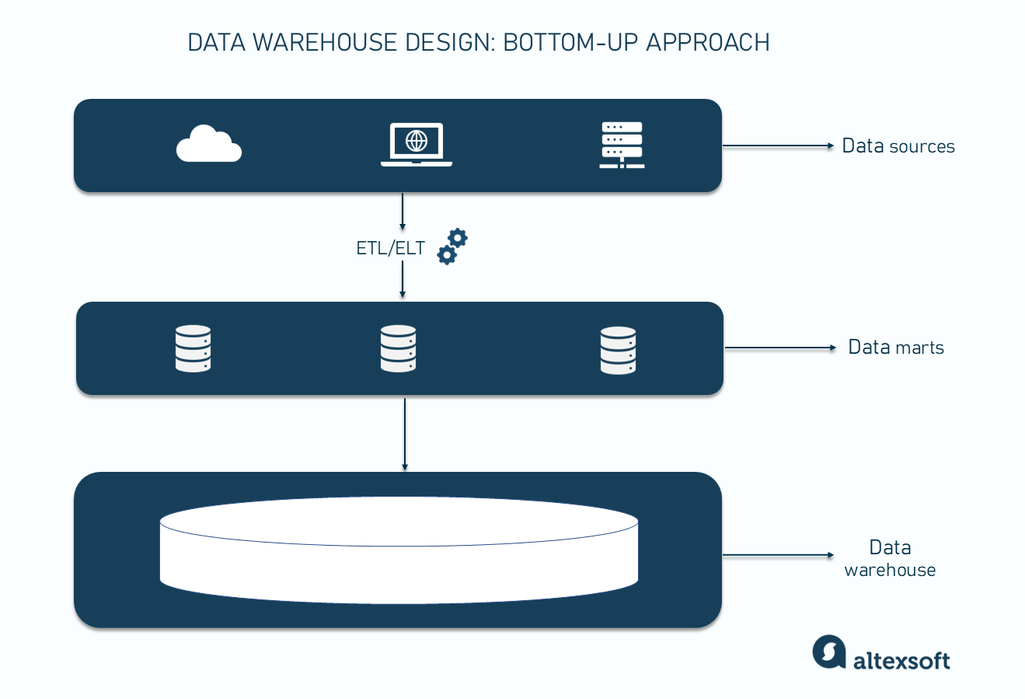
Pros. The bottom-up approach allows for faster implementation, as individual departments can start using their data marts without waiting for the full data warehouse to be built.
Cons. This approach can result in data inconsistencies across different marts and may lead to data silos if not properly managed. It may also require more effort when integrating the data marts into the data warehouse later.
Hybrid approach
In the hybrid approach, an organization starts with creating the warehouse (as in the top-down approach) but implements it incrementally through a series of data marts (as in the bottom-up approach). It leverages the strengths of both approaches while addressing their weaknesses, leading to a comprehensive solution.
Pros. It provides departments quick access to data (via marts) while simultaneously building toward a unified, enterprise-wide solution.
Cons. It requires proper planning, as managing the development of the central data warehouse and individual data marts can be complex.
How to design a data warehouse: best practices
Here’s a step-by-step guide to follow when designing a data warehouse.
1. Create a team for the project. It should include a data architect, data engineers, specifically an ETL developer, system analysts, and other specialists required for the data engineering process.
2. Define business requirements. Engage stakeholders across different departments to understand their needs and expectations for the data warehouse — improving reporting capabilities, enhancing data quality, providing insights into customer behavior, etc. This ensures that the final product aligns with organizational goals. Also, at this step, you need to identify security and compliance requirements.
To make an optimal choice, read about other data storage types like databases and data lakes from our detailed comparison. Also, read our in-depth guide on data lake vs data warehouse to understand their differences.
3. Explore data sources. Analyze the data sources you’re going to integrate — their number, data volumes to be extracted, and data complexity.
4. Conceptualize your solution. At this step, decide on the logical layers of your solution, core functionality, and the preferred deployment option — on-premise or cloud. In the latter case, you still need to choose between public, private, and hybrid environments, depending on your security needs. Also, make up your mind about what approach to follow (bottom-up or top-down).
5. Choose your tech stack. Consider your current infrastructure, data sources, in-house expertise, and security strategy when selecting technologies for each component of the future data warehouse. Your modern data stack should include a data storage solution as well as tools for data integration and analytics.
3. Design data models and data pipelines. Choose schemas for data marts and the main data warehouse. Also, design ETL/ELT flows for data integration.
6. Implement data governance. Strong data governance processes are crucial for maintaining data quality and integrity. This involves setting policies for data management, defining data ownership, implementing metadata management, and ensuring compliance with regulations like GDPR or HIPAA. Regular data quality audits and continuous improvement processes should be part of your governance strategy.
7. Maintain and optimize. After deployment, ongoing maintenance and optimization are crucial for ensuring the long-term success of the data warehouse. This includes monitoring system performance, addressing any issues that arise, and optimizing queries or ETL processes. Also, keep track of evolving business requirements and continuously adjust the data warehouse to accommodate new data sources and analytics needs.

With a software engineering background, Nefe demystifies technology-specific topics—such as web development, cloud computing, and data science—for readers of all levels.
Want to write an article for our blog? Read our requirements and guidelines to become a contributor.

