We discussed .NET framework pros and cons. Now, let's focus on .NET tools that assist in software development, code quality analysis, debugging, and other tasks.


.NET in a nutshell
To learn more about the most useful tools in .NET, we asked engineers from Microsoft, EPAM, AltexSoft, SocketLabs, and other tech firms to share which tools they consider the best.
We’ve also structured the tools into six groups: IDEs and code editors, debuggers and decompilers, package managers, formatting tools, performance analysis, and management tools, and testing tools. While Xamarin, the main mobile development tool isn’t included here, you can read our dedicated article on it.
IDEs and code editors for .NET
Visual Studio IDE: best-in-class IDE for Microsoft development
Visual Studio is a full-featured development platform by Microsoft that allows you to create, modify, and ship code from start to finish. Microsoft suggests multiple payment plans for the IDE to allow individual engineers and enterprises to leverage its rich toolset, including Visual Studio Community - free for individual developers and non-enterprise organizations limited to five users.
A .NET developer at Redwerk Olga Kagitina considers VS the most comprehensive IDE on the market: She describes it as: “well maintained, reliable, mature IDE, with a lot of functionality.” Among the useful VS features Olga highlights code completion features, database management, performance, and code analysis.
Code auto-completion. The platform’s IntelliSense code editor supports auto-completion based on language semantics and source code analysis, it offers hints and API code editing.
Repository integration. To connect Visual Studio to a project or repository, developers use Team Explorer. A .NET solution architect at AltexSoft Yevhenii Zabielyshynskyi notes, “For a long time this tool was used primarily to work with Microsoft TFS, but now it provides a rich set of options to work with Git repositories including GitHub (recently acquired by Microsoft), GitLab, and Bitbucket.” Yevhenii highlights Team Explorer’s simple, fine-structured graphical interface: “It helps me conduct the majority of everyday tasks seamlessly without leaving the Visual Studio window”.
Database development. SQL Server Explorer is a VS tool for building and managing SQL databases directly from Visual Studio, which significantly streamlines database operations.
Troubleshooting at production. Joe Cooper, a lead developer at SocketLabs, considers Visual Studio “priceless” for quick troubleshooting of production problems: “If you have a suspected memory leak or deadlock, capturing a memory dump and analyzing it in Visual Studio will give you definitive answers”. Among VS advantages Joe also names its ease of use: “Simply right-click out of task manager and analyze with tools of your choice on your local machine,” and production machine analysis: “It easily allows you to analyze the state of a production machine with minimal impact on it.”
Debugging. With Visual Studio IDE, developers also have access to a host of debugging tools. Microsoft certified .NET developer Marek Chramosil considers VS debugging tools “best on the market.” Another reason for him to use Visual Studio is its “excellent development support.”
Generally, Visual Studio is the first option to consider if you start working with .NET.
Visual Studio Code: a lightweight version for code editing
If Visual Studio is too overwhelming and you just need a code editor, you can opt for a lightweight Visual Studio Code. It’s free and can be used in many engineering scenarios, including cross-platform development (Linux, Mac OS, Windows). Similar to Visual Studio, the Code distributive supports IntelliSense code completion features, debugging, Git integration, and extensions. Vasyl Novikov, a software engineer at Microsoft, says that compared to other code editors like JetBrains Rider, Visual Studio Code has better extensibility and can be used not only with .NET and C# but almost with any programming language.
JetBrains’ Rider: a new fully-fledged IDE
The Rider is a relatively young, proprietary (a 30-day trial available) .NET IDE. It supports .NET and .NET Core applications on Windows, Mac OS X, and Linux. Slant.io reviewers note Rider’s fast performance, multiple platform and runtime support, version control integration, and wide decompiling capabilities.
As Vasyl notes, JetBrains Rider is his team’s go-to IDE for .NET Linux development, as it runs well on Linux and supports all types of projects they need: console, web, and libraries. Vasyl compliments Rider’s code editor: “It has all ReSharper (an extension for Visual Studio that we discuss below) features like navigation, search, refactoring, code inspections, quick-fixes, decompiler, etc.” and also remarks on its seamless Version Control Systems integration.
Many engineers switch from Visual Studio to JetBrains Rider, as it offers a better overall experience: It has higher performance and it’s easier to use. Another reason to consider Rider is its pricing: commercial licenses for Rider are $139 for the first year, while Visual Studio costs $1,199 per year for the Professional edition and $5,999 per year for Enterprise.
Visual Studio extensions
As we mentioned, Visual Studio is very customizable, particularly via its extensions. Diverse in their complexity level, VS add-ons can extend Visual Studio IDE with new features or integrate the existing tools within it.
ReSharper by JetBrains: a must-have add-on for VS
Another JetBrains product, ReSharper is a popular developer productivity extension. The improvements that come with it are better refactoring, an improved code snippet and template engine, additional static code analysis, and much more. A .NET department coordinator at ScienceSoft, Maxim Saplin, calls it a great tool for the vast majority of .NET developers. He adds, “ReSharper detects errors and provides a myriad of automatic fixes, simplifies code changes, and allows for quick navigation across the code.”
Olga Kagitina prefers ReSharper as it helps her analyze the code quality, provides profilers to optimize the code for performance and avoid memory leaks, and generally does a lot of work for you like creating constructors, conditional blocks, and new classes. “If you want to optimize and improve your .NET code - you should give ReSharper a chance,” - she says.
Сommenting on ReSharper, Marek Chramosil emphasizes its automation capabilities: “ReSharper automates many common development and refactoring scenarios, that would otherwise be very time consuming, boring, and error-prone for a human.”
NDepend: the right tool for a thorough code analysis
NDepend is another code analysis tool available as a Visual Studio add-on. It checks the source code quickly and accurately, providing detailed, precise, and measurable metrics.
Olga Kagitina claims that NDepend provides great functionality to review your code and view dependencies along with metrics. She also stresses its ability to customize the analysis to your specific needs.
Visual Studio Cloud Explorer: a solution for interacting with Azure Cloud
The Cloud Explorer tool allows you to manage Azure Cloud resources, inspecting their properties, and performing developer diagnostics actions right from Visual Studio. Olga Kagitina adds on this point: “If you work with Azure - it will save you a lot of time because you do not need to get to the Azure portal, all that you need you will be able to see within the VS.”
Package Managers
Package Management support enables continuous delivery workflows by hosting your packages, modules, libraries, etc., and making them available to your team, your builds, and your releases. So, it’s an important addition to your .NET ecosystem.
NuGet: a common tool for creating, sharing, and consuming .NET libraries
NuGet package manager with its Gallery is a central package repository to use with .NET. It has about 150 thousand unique packages and more than 1.5 million package versions. While NuGet is your main instrument to introduce frameworks, libraries, and modules into your .NET projects, it’s better used with an additional explorer tool.
NuGet Package Explorer: a new way to interact, explore, and publish NuGet packages
This open-source product has a user-friendly interface for creating and exploring NuGet packages. Alexander Geraschenko, a software engineer at AltexSoft with over eight years of .NET experience, shares: ”When we started creating NuGet packages for parts of our project, the NuGet Package Explorer utility helped to debug and analyze created packages. It has a clean, lightweight, and intuitive graphical user interface.”
npm: now available for .NET libraries
Package management isn’t only about NuGet. Yevhenii Zabielyshynsky notes that over the last few years Microsoft Visual Studio added npm support in addition to the traditional NuGet manager to source libraries for web development: “It makes dramatic difference for the Web project and enables using the modern web practices, tools, and open source code together with the backend written on .NET Core.”
Debugging and decompiling tools
Debuggers allow developers to look into the code and identify the root cause of various issues on any development stage. We also added decompiler tools into this section that convert compiled third party code back into C# to troubleshoot it.
WinDbg: standalone debugger for Windows
If you need to debug Windows applications WinDBg is purpose-built for that and distributed by Microsoft. While traditionally engineers use built-in IDE debuggers, WinDbg can run outside of Visual Studio, which makes it a good option for developers who prefer open source and free software.
The tool is used to debug kernel-mode and user-mode code, check crash dumps and CPU registers.
dotPeek by JetBrains: a great free tool for decompilation
dotPeek is a reliable ReSharper-based decompiler, helpful for debugging third-party assemblies and code. Using dotPeek, you can examine problems that occur in third-party components, even without having direct access to their source code, which Marek Chramosil believes is sometimes invaluable.
G2 reviews describe it as a simple, effective, and comprehensive tool. Oleksandr Fomenko, a software test automation engineer at EPAM Systems, shares his experience working with dotPeek: “On the project, we faced the need to restore the existing code from the DLL files of the specific version of the application. dotPeek has proved effective in recovering the lost code in the shortest time.”
ILSpy: a decent replacement for .NET Reflector
ILSpy is a .NET assembly browser and decompiler. It's a good open-source alternative to .NET Reflector which no longer has a free version. The tools can decompile any .NET DLL back to either Visual Basic or C#. In case you lost your source code or didn’t have it in the first place, ILSpy lets you see how the code behind the framework DLLs works. And you can always enhance its basic package via plugins.
Formatting tools
With formatting tools, you don't have to adhere to a consistent code style, as they do it for you. Detecting and fixing a broad range of style offenses, you can set them up in your IDE to work real-time as you’re typing.
SonarQube: an easy tool for maintaining your code quality
SonarQube is an open-source static code review tool, good for analyzing .NET managed code. It consists of a set of static analyzers, a data mart, and a portal where you can manage your technical debt. Along with its strong community, SonarQube provides additional analyzers that can be added as plug-ins. Easy to setup and configure, SonarQube has rich built-in rule-sets: coding standards, best practices, security, and convention.
Oleksandr Fomenko from EPAM tells us that SonarQube allowed them to standardize the code and visualize the percentage of reviewed code coverage: “It resulted in improved code maintainability, increased code quality, and reduced code review effort.”
StyleCop: a configurable tool for .NET code styling
A local code analyzer, StyleCop enforces style and consistency rules on the source code. It allows developers to customize the rules if they choose so. The tool is available in three forms:
- The StyleCop Visual Studio extension: runs on any file, project, or solution in Visual Studio without any source code modifications
- The StyleCop.MSBuild: runs on .NET 4.0+ projects
- StyleCop.ReSharper: a plugin that configures ReSharper to use default settings matching StyleCop rules.
Performance analysis and management
On encountering a performance problem, it’s necessary to collect details on the problem that occurred. Using the following tools, .NET developers can trace the machine's performance to figure out what caused the issue.
PerfCollect and PerfView: a standard in the .NET performance tuning toolbox
PerfCollect is a Bash script that automates data collection, while PerfView is a Windows-based performance tool. You can use PerfCollect to capture perf trace files and then analyze them with PerfView.
PerfView can be used for CPU and memory allocation tuning. Joe Cooper from SocketLabs singles out these pros of PerfView:
No installation needed. “Just simply copy the application to the windows machine you wish to capture performance data from, configure what it will profile, and start capturing”.
No application alterations necessary for profiling and low performance degradation. “...it could be used to profile a production application, at least for short periods of time without too much concern.”
Results presented in a similar fashion to Chrome performance tools. “There is a bit of a learning curve to using the tool, but if you know Chrome, you know them both.”
dotTrace and dotMemory by JetBrains: performance and memory profiling
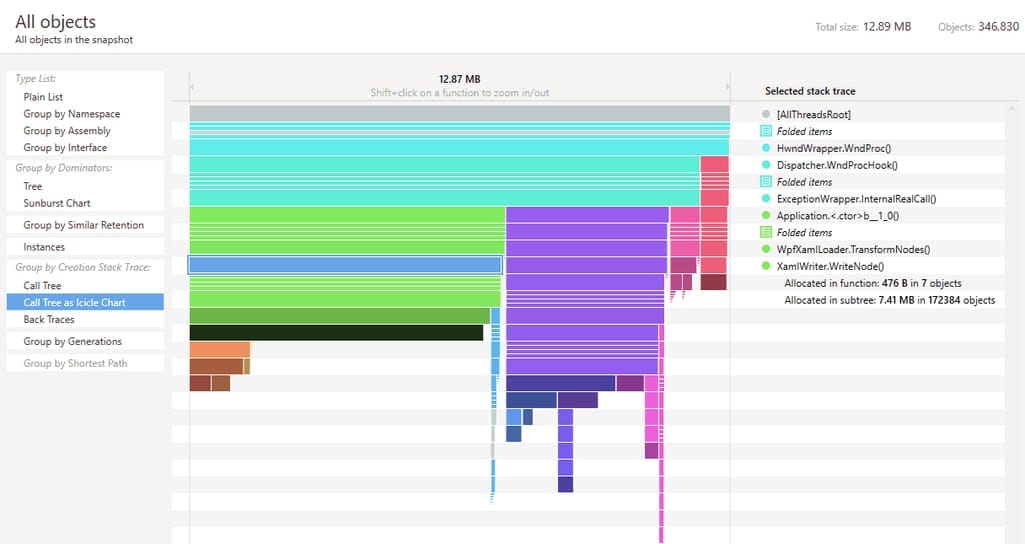
dotTrace and dotMemory are profiling tools for tracking performance and memory issues in .NET applications. Able to process large volumes of data, they display it to the user in a comprehensive way.
dotMemory multiple views on data
dotTrace features include performance bottleneck detection, call stacks analysis, performance timelines reporting, and many other profiling actions. dotMemory has remote profiling, automatic inspections for any memory issues, memory traffic analysis, memory snapshots comparison, etc.
“You can use these tools to detect the exact places in the code that led to memory leaks faced in production,” suggests AltexSoft’s Alexander Geraschenko.
BenchmarkDotNet: a powerful .NET library for benchmarking
BenchmarkDotNet is an open-source project that eliminates performance guesswork and gives you metrics by automatically isolating each benchmark and running several iterations including the warm-up. “It lets you write performance tests, so you can measure and compare the performance of your algorithms,” explains Microsoft’s Vasyl Novikov. This tool is an example of how small programming tool can give reliable results and improve your productivity.
Testing Tools
Visual Studio MSTest: a popular framework for unit testing
The MSTest framework occupies a distinct position in the Visual Studio product family. As the .NET pattern for unit tests is having a separate test project for each production project, MSTest keeps it as easy as File->New Project. On writing a test, you can have test results displayed in the IDE.
NUnit: an excellent test-runner
Interoperating nicely with non-Microsoft platforms and custom test runners, NUnit is acclaimed for fast test running and additional features like test annotations - simple specification of multiple inputs to a given test. However, NUnit doesn’t integrate into Visual Studio as seamlessly as MSTest does.
“It’s very customizable, as it has a wide range of attributes while also enabling custom attributes,” notes Oleksandr Fomenko. “Thanks to that, tests can be categorized and further easily launched according to certain parameters. Also, having a console runner, NUnit makes it easy to integrate tests into the CI-process.”
xUnit.NET: an innovative .NET unit testing tool
xUnit creates an intuitive terminology for the test language. Dividing tests into “facts” and “theories”, xUnit distinguishes between “always true” and “true for the right data,” respectively. xUnit is considered to be extensible. Vasyl Novikov from Microsoft underlines that xUnit is used in the company to develop .NET Core itself.
JetBrains dotCover: code coverage tool for continuous testing
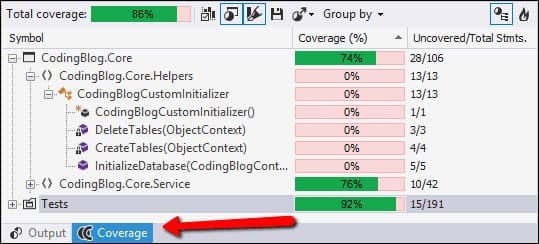
dotCover is a code coverage tool that analyzes your code and reports how much is covered by unit tests. Part of the ReSharper package, dotCover can work both independently of ReSharper and together with it.
dotCover report, Source: O’Reilly
“We were using JetBrains dotCover utility as a part of our Continuous Integration process together with JetBrains TeamCity CI server to see how much code has been covered by unit tests and what parts of the code should be covered as well,” comments Alexander Geraschenko.
Other useful tools to consider
LINQPad: a multifunctional tool that connects to databases
LINQPad is a lightweight .NET application used to interactively write C# code without an IDE. The tool can run not only simple queries but also a series of queries. It has an integrated debugger and autocomplete capabilities (IntelliSense support).
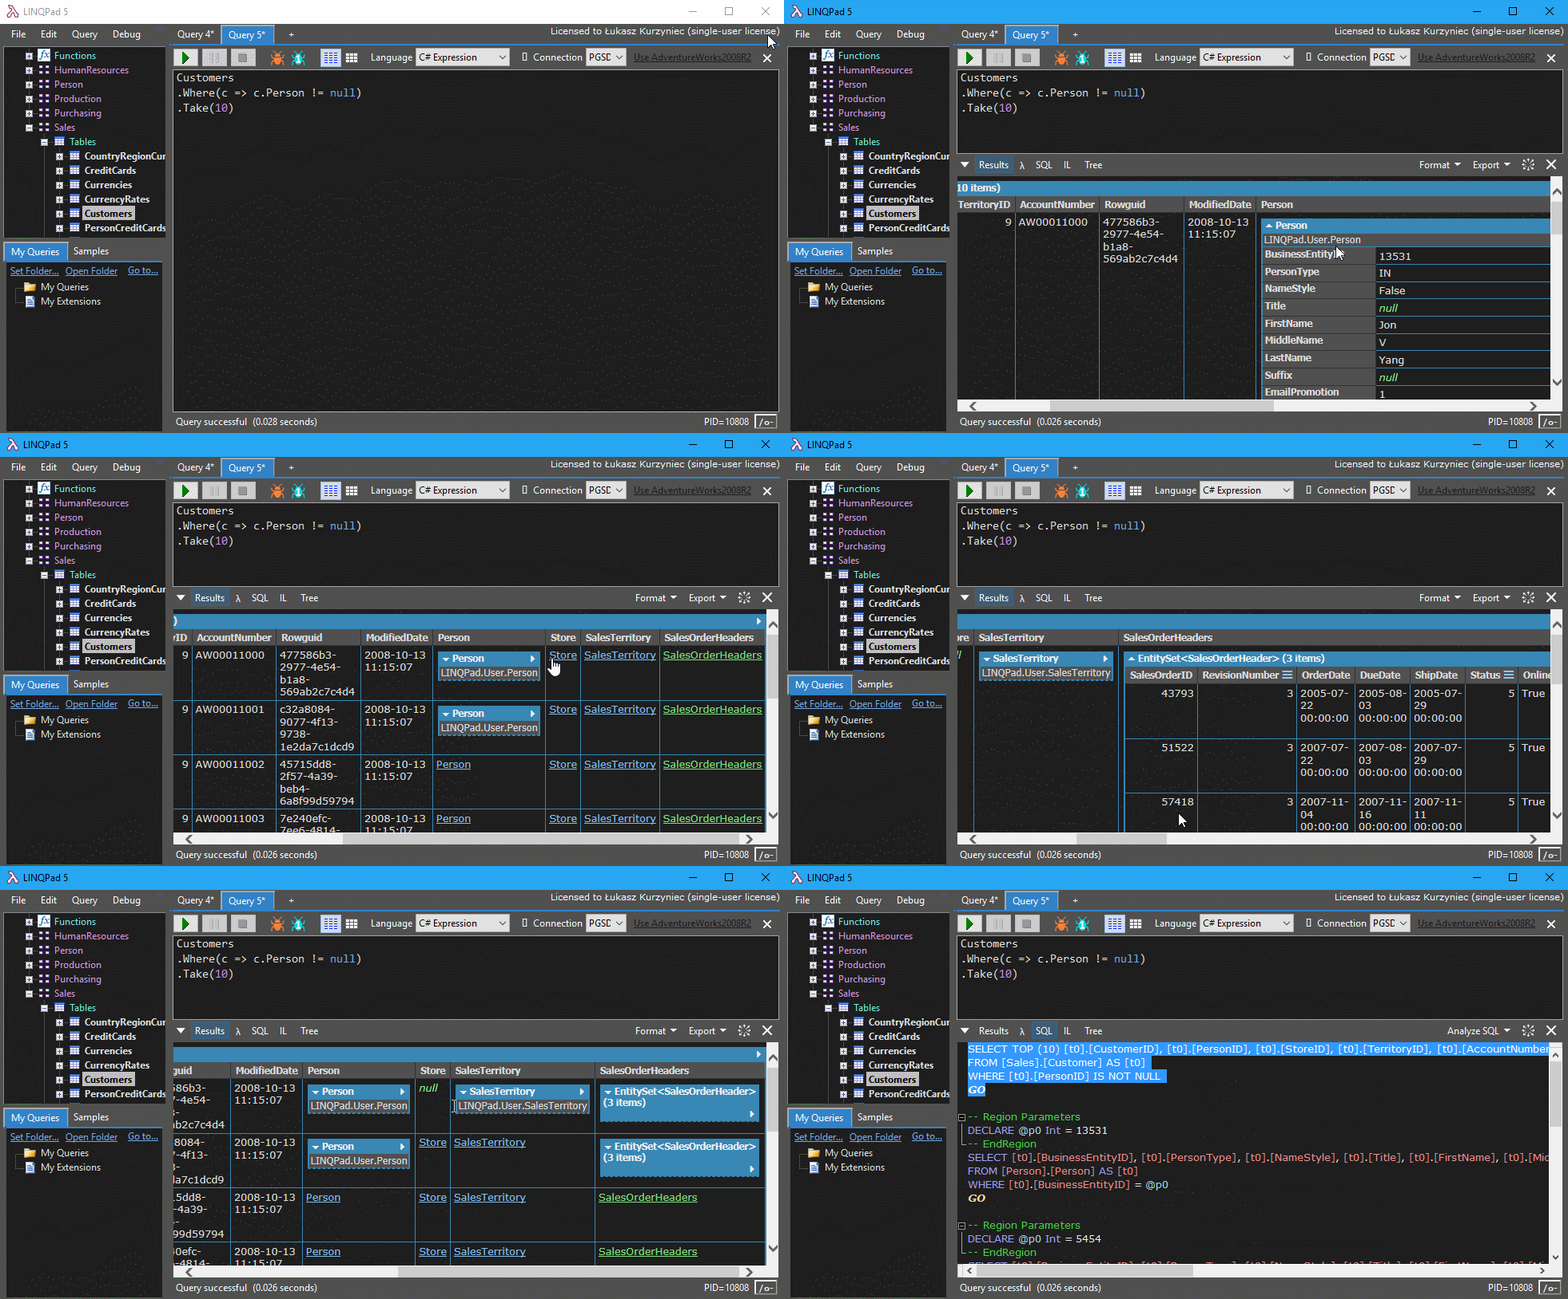
One of its main functionalities is the ability to execute database queries using LINQ, which it further translates into pure SQL. Then you can modify the data and transform the database schema.
Executing database queries in LINQPad, Source: Łukasz Kurzyniec
From using LINQPad in the development of a custom billing platform, A .NET department coordinator at ScienceSoft, Maxim Saplin, sees its benefits in rapid and convenient prototyping, fast algorithms testing, and LINQ queries verification.
dotnet-script: simple scripting for your experiments
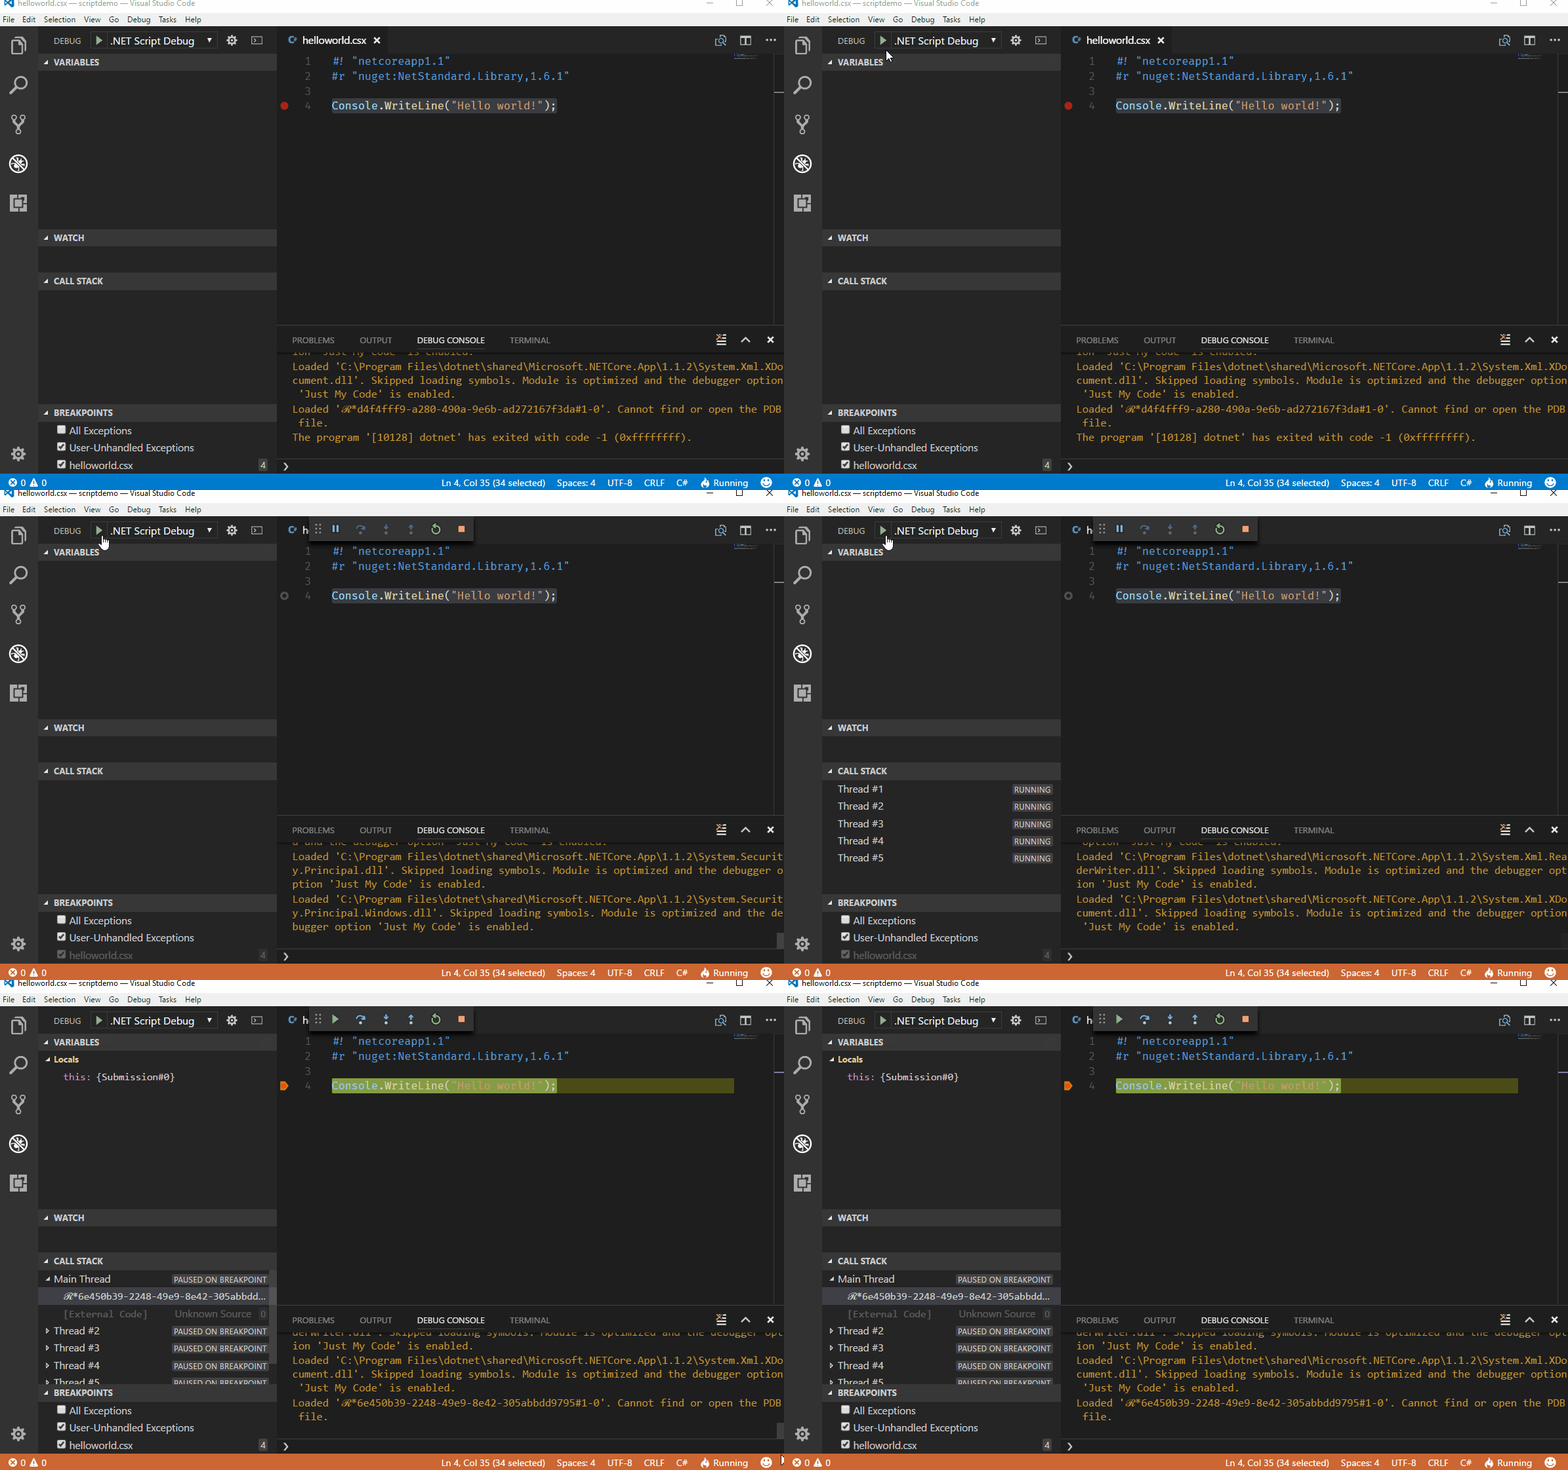
Dotnet-script is a cross-platform .NET Core tool equipped with IntelliSense. It can debug scripts directly in Visual Studio Code. Supporting NuGet packages, dotnet-script code is relevant and can exist in a single file.
Vasyl Novikov chooses dotnet-script for his prototyping needs: “I use it very often if I need to try something very simple and don’t want to create a whole new project for that in IDE”.
Script debugging using dotnet-script, Source: GitHub
How to choose your .NET toolset: key factors
We also asked our experts how they narrow down the list of available toolset options for their .NET projects.
Project goal and simplicity. Yevhenii Zabielyshynsky focuses on the goal of the job: “The tools I use should not take any time and attention to the tool itself. Also, I don't like to spend many hours configuring them. So I strive to have my tools list as short as possible."
Usefulness in routine tasks. Marek Chramosil prefers tools that help him solve time-consuming tasks. He shares, “I decide mostly based on whether the tool will save me something (time, programming errors, etc.) or whether it helps me avoid or automate annoying/repetitive activities during the development.”
Joe Cooper also shared his list of determining factors:
Easy deployment to the production environment with minimal impact on it. “... for memory profiling there are plenty of options out there, but not many that will allow one to capture memory allocations without interrupting an application to configure some sort of bootstrap”.
Solid reputation. “I was introduced to PerfView by a book published on the topic of performance tuning. Naturally, I am going to trust a tool endorsed by an author on the topic more than say a homegrown tool developed 6 months ago by a random developer on GitHub.”
Price. “A price tag or free trial period usually impedes the task at hand and I'm quick to move on to free options.”
Components. “In my tooling search, I often know ahead of time what features I am looking for. If I'm looking for features A, B, and C, a tool offering A, B, C through Z might work”.
Learning curve. “I may opt for a simpler tool focused on A, B, and C that doesn't complicate the task at hand.”
Let’s keep the conversation going. Tell us about your first-choice .NET software and how they enhance your everyday tasks. Leave your comments down below.

