How do you measure a product’s success on the market? Usually, in addition to sales volume and market share, you tend to use the most popular product management KPIs. They help with measuring product success across different stages of the product life cycle.
One of the most efficient and valuable metrics to implement here is the Net Promoter Score. It shows how many of your customers can be considered loyal – those who are the least likely to abandon your product for a competitor. F. Reichheld, creator of this approach, in his Harvard Business Review article, considered it “the only number you need to grow.”
So, how do you understand the number and what do you do with this information? In this article, we’ll define net promoter score (NPS), explain how to apply it, and suggest further steps to take.
What’s Net Promoter Score?
Traditionally, the net promoter score (NPS) is calculated by asking your customers one question: How likely is it that you would recommend our company/product/service to a friend or colleague? A user is presented with a 0-10 scale, with 0 being the least likely and 10 being highest likelihood they would recommend it. People answering the question are then divided into three groups:
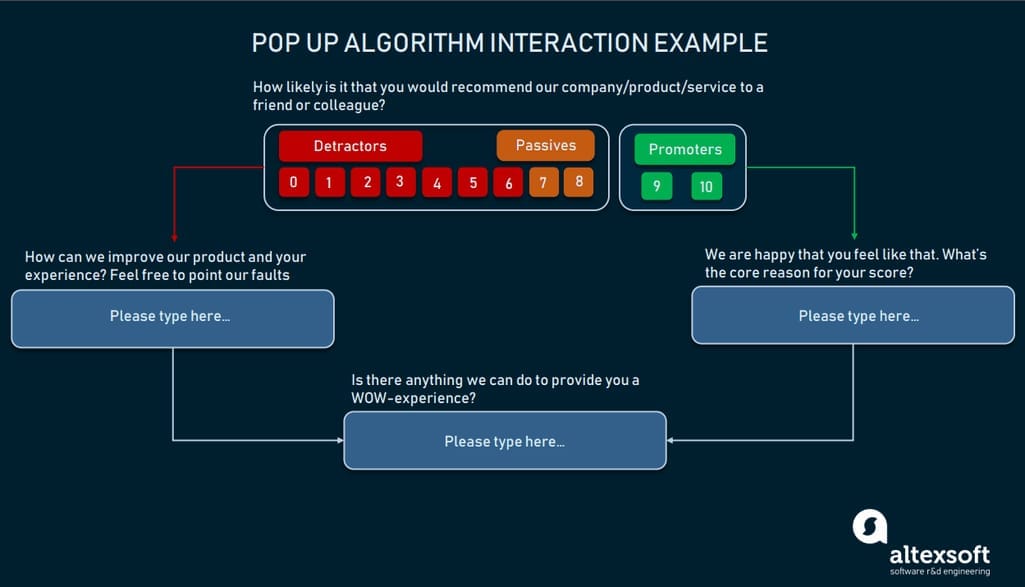
Detractors score a product from 0 to 6. They are completely dissatisfied and won’t advocate your product or service. Even worse, they will badmouth it at every opportunity.
Passive customers grade your product within 7-8 points. Basically, this group doesn’t care at all. They are more or less satisfied until they see a new or more attractive competitor and switch to that.
Positive customers or promoters are those evaluating a product at 9 or 10. As we said before, they will advocate your product no matter what. These are the most valuable contributors to your product’s success through the word of mouth.
So, based on your single-question survey, you define the percentage of Detractors, Passives, and Promoters, and then calculate NPS by finding the difference between promoters and detractors:
(Promoters-Detractors)/100=NPS (%)
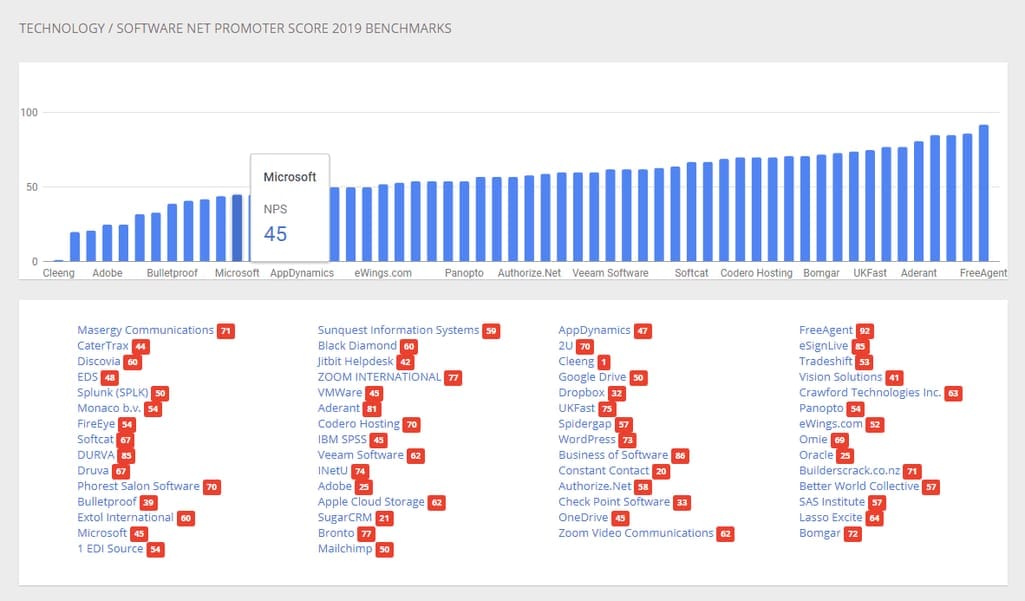
Here, you should understand that results may vary from -100 percent through 0 to 100 percent, and there’s no optimal NPS result. A good one is anything above 0. For instance, Amazon has a Net Promoter Score of 69, which is over 30 percent above its industry norm. At the same time, Apple shows 72 for NPS, and this is way higher than the 32 percent standard for the computer hardware business. Meanwhile, Netflix places themselves leading the race with their 68 Net Promoter Score.
Customer Guru is one of many NPS benchmark aggregators
Follow-up question
NPS isn’t a very insightful metric when it comes to improving your product. It doesn’t tell exactly what makes people feel happy or disappointed. To yield more insights, you can include a follow-up question. There are plenty of versions, but the traditional one is:
What is the reason that you gave us this score?
And this is the point to start further actions from. It will help you improve the product and send another NPS survey again. How to adopt Net Promoter Score with your product
So how do you implement NPS survey into your product development and maintenance process?
How to adopt Net Promoter Score within your product
How to adopt Net Promoter Score with your product
So how do you implement an NPS survey into your product development and maintenance process?
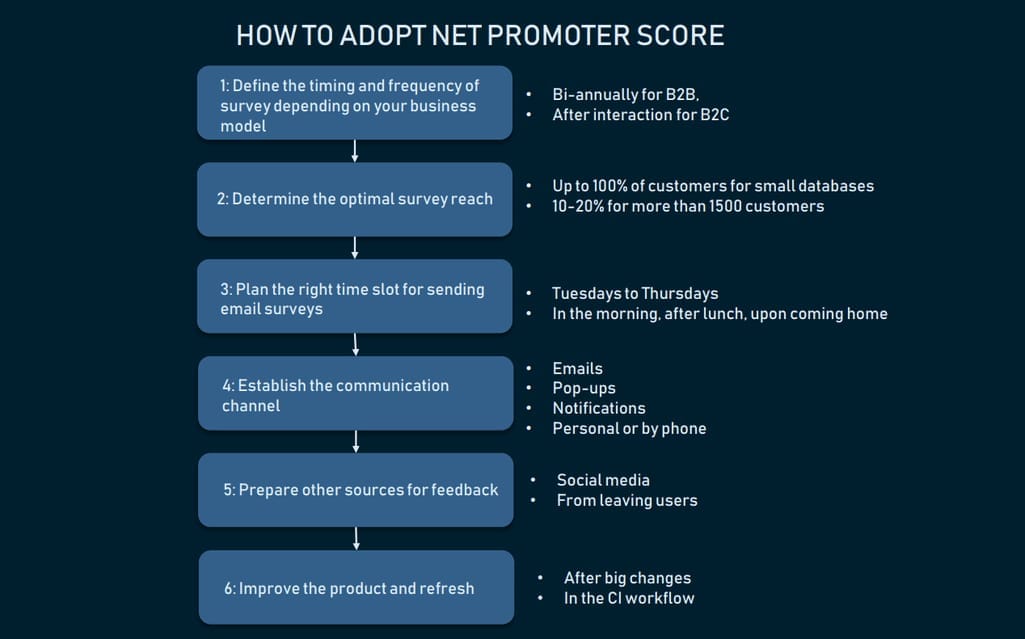
Step 1 - Define the right timing and frequency
First of all, specify the timing for submitting your scoring survey. The frequency depends on your business model.
Relationship approach for B2B. Here, surveys are sent recurrently on an ongoing basis, without reference to any specific experience. For instance, if you’re running a SaaS business, it would be your go-to way to evaluate your business’ relationship with its clients. Mapping your customer satisfaction time after time, you can at the same time detect the points to pay attention to. The perfect timing depends on your preferences, but normally, surveys are sent once a quarter or bi-annually.
Transactional approach for B2C. If you have an eCommerce store, it’s the best method to assess your product with its customers. The survey is sent within a few minutes after the valuable action. However, it’s not always the best method to measure customer experience. Instead, let them finish a full buyer journey. After that, you’ll have a more robust picture based on a complete buying experience.
Step 2 - Determine the optimal audience size
Processing feedback from customers is the next step after sending NPS surveys. Defining the right target-audience size to cover is a significant step. It directly impacts the relevance and accuracy of results.
Massive (50-100 percent). Such bulky surveys are only reasonable if your product is just at its start, and your customer database is not that big. Sure, the more emails you send, the faster you’ll get the result. But this is the case if you use automated processing tools. Otherwise, be sure that you have sufficient resources to process all responses and consider all answers to follow-up questions.
Small samples (10-20 percent). Sending NPS surveys to a lower number of customers results in faster data processing and consequent iteration. The other point here is a popular assumption that there’s always a 10 percent error in surveys and only 15 percent of recipients respond to surveys. So, there might not be enough data to work with. If your customer database is big enough, consider surveying no less than 1500 customers. If it’s too small, enlist all of them.
Step 3 - Plan the perfect time slot
Bear in mind that the right period of time for sending NPS surveys is another aspect that impacts the response rate. Since about 19 percent of all emails are opened within the first hour of delivery, hitting the right time slot becomes even more critical.
Tuesdays to Thursdays. Different statistics vary in determining the best day to send emails with surveys. On the one hand, GetResponse and Experian studies agree about Tuesday being the best day for emails (with about an 18 percent open rate according to Experian). Thursdays are the second best option. At the same time, Harland Clarke Digital proves that Wednesday is the best choice with Tuesday as the second best.
Best business hours. Here the statistics also show different cases. For instance, GetResponse indicates three optimum time slots to get a survey open and responded to: 10:00-11:00 am, when people have already fixed their urgent issues and have a few-minutes break; 2:00 - 3:00 pm, after addressing immediate after-lunch questions, and after 6:00 pm, upon coming home. At the same time, HubSpot data suggests most emails are opened at 11 am, while WordStream’s numbers show the best result for a timeslot between 8 am and 9 am.
Schedule time zones. Upon choosing the right time slots for a survey, don’t forget that your customers or users may live in different countries and, therefore, different time zones. Consider scheduling your NPS surveys to reach your target audience at the most effective and relevant time. Here, the usage of so-called smart send is reasonable. Options of that kind are available via MailChimp or HubSpot, and many other email marketing tools.
Step 4 - Establish relevant communication channel(s)
Choosing the most suitable channel to reach the target audience is another opportunity to make an NPS survey work better. There are three basic options to consider when distributing the poll.
Email. This type of surveyance is arguably the most classic one. Albeit suitable for both transactional and relationship approaches, it’s rather contradictory.
On the one hand, the possibility of getting sufficient feedback from customers is incredibly small as there is a common opinion that only 10 percent of surveys are open and completed. The primary reason for that is that part of them goes to the junk folder. To prevent this, avoid using all capital letters and spam-triggering words in subject lines, don’t include too many recipients, and send from company email accounts.
On the other hand, email surveys can give clear and sustainable results. Why? Because this is feedback from customers who value the product enough to spend an extra five minutes on it.
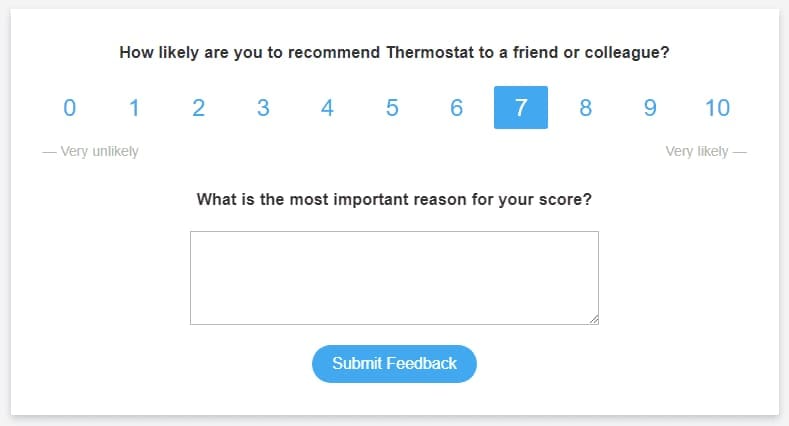
Pop-ups. This option is a popular and quick method. Usually represented as a pop-up window, it allows getting the opinion on a service or a product at once.

Example of an NPS popup provided by Thermostat
The main bottleneck here is that customers usually close an app or a website as soon as they finish interacting with it. So, they might not even notice the survey. The best practice here is to schedule the pop-up right upon process completion. The other option here is to build the survey into the confirmation window as the follow-up, making customers more likely to provide feedback straightaway.
Pop up algorithm interaction example
Notifications. This communication method is an efficient way to measure NPS when you have a mobile product. It takes its advantages from quick, built-in integrations and mobile outreach.
At the same time, many customers tend to mute or skip such messages because they’re too busy, and never go back to them. That is why, before opting for messages, ensure that the customers are okay with receiving push notifications on NPS surveys by warning them in advance.
Personal or phone interviews. If you run a niche B2B product with a handful of users, there’s no point in inventing automated approaches. You can directly call your customers or even schedule an interview. This, of course, works for really small groups of customers.
Step 5 - Consider other sources to receive feedback, besides the NPS itself
Among all the options to get in touch with customers mentioned above, use additional methods to generate user feedback for your product. Usually, this step is taken to enhance and complete customer feedback, but not as a substitution for it.
Social Media listening. Basically, it enables tracking product mentions across social media platforms. Besides, if tuned properly, Social Media listening allows for discovering the popularity of services or products that are similar to yours. Above all, it is a great mechanism when building a product marketing strategy or adjusting it according to user opinion. When opting for a particular solution, analyze what social platform is the most suitable for your product. Or you can mix them as well. For example, if you consider multiple platforms, Awario or Agorapulse with different outreach scale and pricing models are excellent for starters. If you treat Twitter as your starting point, use such tools as TweetReach or TweetDeck.
Ask for feedback from abandoning customers. If your SaaS product started losing its subscribers, or increasingly more customers are leaving your eCommerce store, asking them for feedback upon leaving seems a good choice. For example, send them an automated message upon unsubscribing, where they would point to the reason for their decision. Here, a nice alternative to the type-in field would be multiple options to choose from. Also, don’t neglect the chance to ask for an overall opinion about not just a product, but the company as a whole. This feedback might be unexpected but will significantly impact your product development.
Step 6 - Process NPS results and take actions
When you’ve gathered feedback from different channels, it’s time to convert the data into meaningful results.
Outline a critical mass of issues. When processing the collected data, a product team usually sees frequently occurring results – critical points in product usage. Product managers then take note of the most important cases to improve.
Conduct market research. A customer may request something from a product that’s not in line with a product-market fit. To avoid a waste of resources, the marketing department in alliance with a product team reviews the market demand, discovers similar cases among the competitors, and seeks the most effective methods to implement changes within the business niche.
Take decisions on further steps. Based on the market research, stakeholders and the product team in cooperation with marketing officers decide how to make the improvements happen. This process may include holding a product workshop, recompiling a product roadmap, and other marketing and predevelopment activities.
Form a backlog and make improvements. When all the preparatory activities are done, the product manager forms the backlog and submits it to the engineering team. Together with stakeholders, the product team allocates tasks according to one of the prioritization techniques. The product improvements begin here.
Step 7 - Send the survey again after implemented changes
Once engineers have modified a product, it’s time to re-attract customers to NPS surveys and refresh their opinion on your product. The NPS gathering process should be ongoing and transformative.
But how to keep up with different types of updates?
After a big pool of changes. Usually, meaningful product transformation is implemented by large assemblies. Later, they significantly influence the overall product workflow, and therefore, user experience. In this case, you should re-engage users shortly after these changes. When sending a survey again, do not forget to indicate the reason why you are asking them for feedback.
Within a continuous integration. Many products also use continuous delivery and integration as their main development framework. In these cases, a customer’s eye may not even notice sustainable changes, though they usually make the workflow smoother. In this situation, you should stick to your regular NPS survey schedule, otherwise, customers might skip it if overloaded. At this point, consider mentioning those improvements in the email when sending your next NPS survey.
Further interaction - There are more steps to take
Sure, measuring your Net Promoter Score alone is not enough to make your product bring increasing value to both you and your customers. To keep within the product/market fit, you should constantly address issues emerging during the product life, aligning with other metrics and keeping your customers engaged.
Complement other metrics
Despite the opinion that NPS is the only customer satisfaction metric that a business has to track, we strongly suggest relying on other, more business- and customer-centric metrics. When combining them in accordance with your market fit, consider both business and product goals.
Business success of the product. Upon rolling out the product, stakeholders put financial metrics first. At the end of the day, these numbers indicate and, to some extent, predict product success and its revenue. Here, among other KPIs, consider including such metrics as Monthly Recurring Revenue and Average Revenue per User. Combined with Customer Lifetime Value, these indicators can give you clear data on your product income from short- and long-term perspectives.
User satisfaction. “Customers’ needs come first” is the rule of thumb for a sustainable product. So, when evaluating customer satisfaction, don’t hesitate to combine NPS numbers with others from the same unit. For instance, alliance with such metrics as Customer Satisfaction Score and Customer Effort Score will help you define the sweet spot to attract more customers and address emerging product bottlenecks.
User engagement. Software product success and revenue is directly related to the number of subscribers and their behavior throughout its usage. Consequently, measuring the level of customer engagement is another critical KPI. While websites rely on Traffic and Session duration metrics, it’s reasonable for subscription products to combine Daily Active User (DAU)/Monthly Active User ratio with Bounce rate. Thus, you’ll be able to track what valuable actions customers take and align these observations with further product improvements.
Appreciate your loyal customers
Outreaching for feedback and aligning it for product improvements are not the only steps to follow in increasing its popularity and revenue. Your promoters have to know that they are not just points and numbers in your scores, but the valuable focal point of success.
Introduce a reward program. After all, your loyal users serve as ambassadors to increase your audience. Let them know that you are grateful for their promoting efforts by giving them special treatment. Track your promoters and appreciate those who directly attract customers by providing one-off discounts, two-for-one offers, or even a gift certificate. It won’t take much to create a wow-effect.
Celebrate the time spent together. For customers, it’s very important that you see their loyalty to your product. Finally, there are plenty of fish in the ocean, and they could have accepted tastier competitor offerings years ago. So, at this point, sending a thank-you letter, or a modest gift card upon reaching a significant time period may very well work in your favor.
Net Promoter Score - Use cases to consider
So, as you see, the Net Promoter Score is quite an efficient instrument in evaluating customer satisfaction. Although we have to admit that when applied alone, the metrics don’t always contribute to increasing product success. It requires an appropriate approach and involves a number of follow-up actions.
While considered controversial in some circles, Net Promoter Score has become a powerful tool for boosting and promoting many large companies across all industries. Here are a few of them.
Airbnb uses NPS on an ongoing basis to measure customer loyalty. They even conducted research on how Net Promoter Score can help in rebooking prediction. The results showed that higher NPS numbers commonly match up with more referrals and rebookings. In 56 percent of cases, a guest’s likelihood to recommend, or LTR, alone at the exit helps the Airbnb team predict if their visitors will book apartments again next year. Combined with primary data on the guest, host, and trip, the predictive truth is increased to over 60 percent.
Slack made Net Promoter Score the key piece of its outreach marketing company. Bill Macaitis, Slack CMO, considers NPS “a leading indicator of future growth.” A large number of product promoters results in lower customer acquisition costs for the company and brings a more powerful customer success. This approach helped Slack become valued at $1 bn in one year through word of mouth.
Amazon also shows marvelous numbers of customer retention from year to year. According to research, 73 percent of people opting in on an Amazon Prime 30-day trial become paid members. One thing leads to another. After the first year, 91 percent of subscribers renew their agreement for a second year, and 96 percent of those prolong their services for a third year, too. All these results are from NPS surveys.
So, considering all the pros and cons for including Net Promoter Score, keep in mind that, with proper controls, it can predict and increase customer loyalty as it has for industry giants.

